Copyright
©The Author(s) 2015.
World J Gastroenterol. Jun 21, 2015; 21(23): 7197-7207
Published online Jun 21, 2015. doi: 10.3748/wjg.v21.i23.7197
Published online Jun 21, 2015. doi: 10.3748/wjg.v21.i23.7197
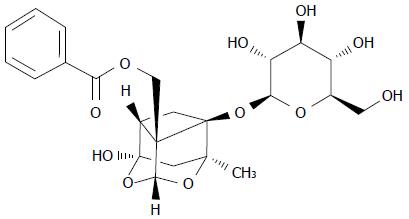
Figure 1 The chemical structure of paeoniflorin.
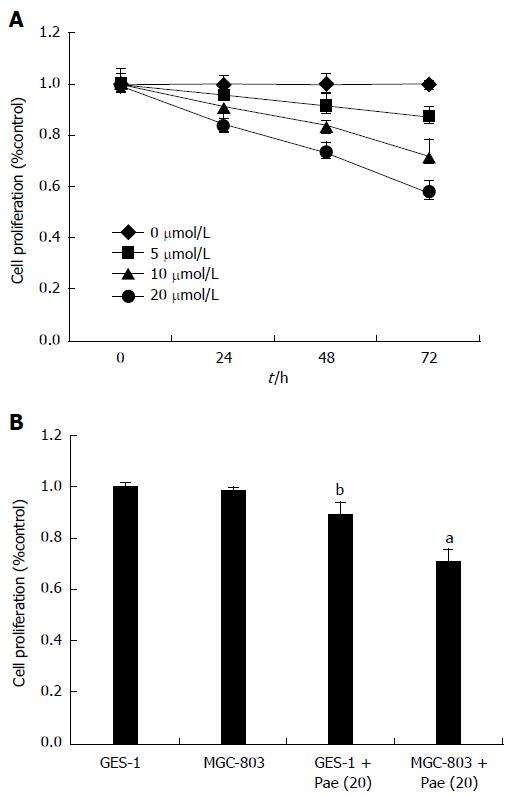
Figure 2 Paeoniflorin inhibits cell proliferation.
Paeoniflorin inhibits cell proliferation of MGC-803 cells after treatment with paeoniflorin (20 μmol/L) for 72 h (A) and cell proliferation of GES-1 after treatment with paeoniflorin (20 μmol/L) for 48 h (B). aP < 0.01 vs 0 μmol/L paeoniflorin treatment group.
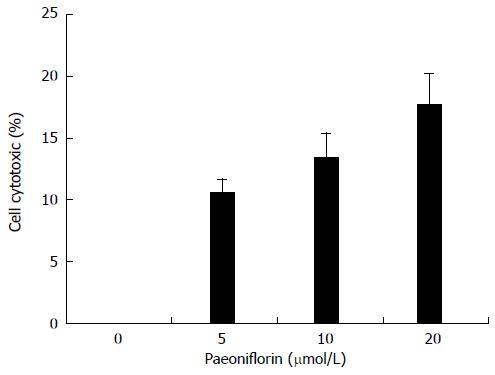
Figure 3 Paeoniflorin increases cell cytotoxicity.
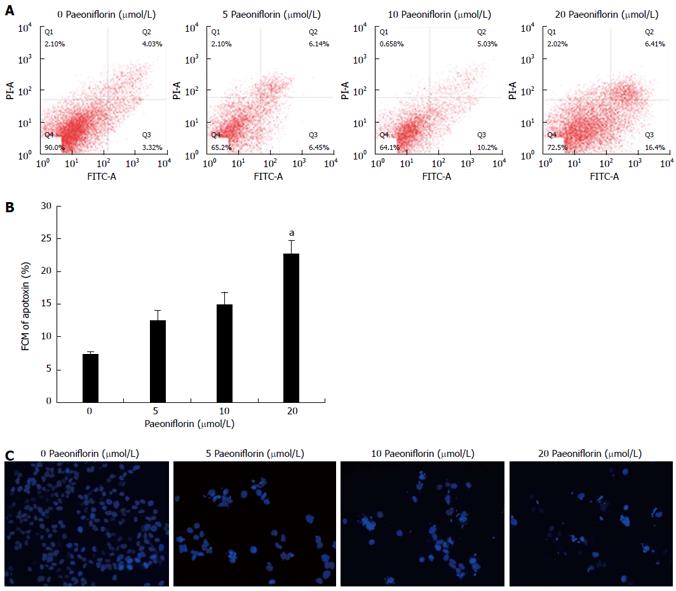
Figure 4 Paeoniflorin promotes apoptosis.
Flow-cytometric analysis for detecting cellular apoptosis (A), statistical analysis of cellular apoptosis level (B) and DAPI staining for detecting cellular apoptosis (C). aP < 0.01 vs 0 μmol/L paeoniflorin treatment group.
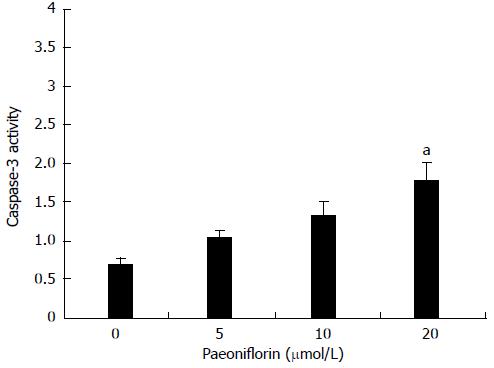
Figure 5 Paeoniflorin induces caspase-3 activity.
aP < 0.01 vs 0 μmol/L paeoniflorin treatment group.
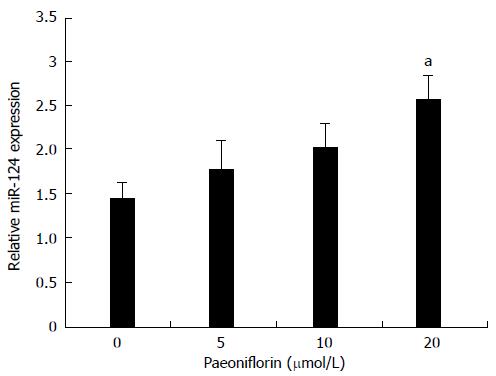
Figure 6 Paeoniflorin activates the expression of microRNA-124.
aP < 0.01 vs 0 μmol/L paeoniflorin treatment group.a
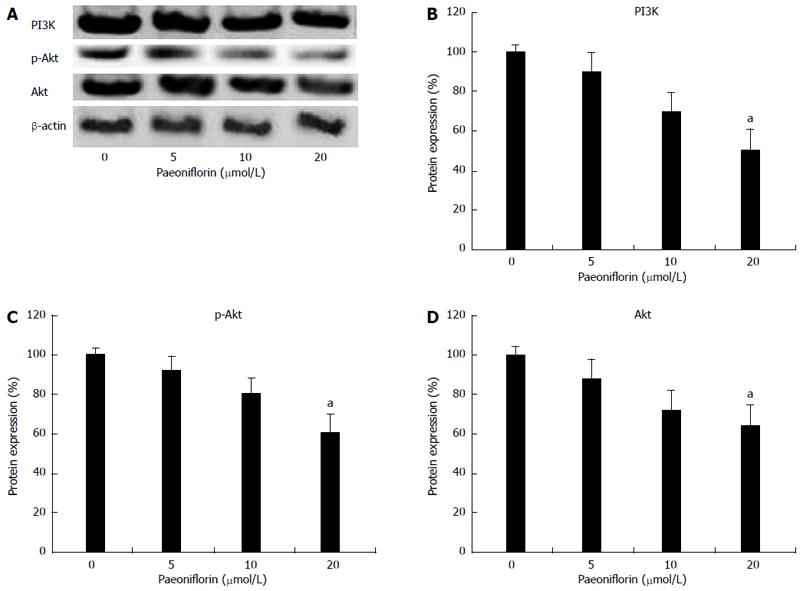
Figure 7 Paeoniflorin attenuates the expression of PI3K/Akt.
Indicated representative western blotting analysis of PI3K, p-Akt and Akt protein levels (A) and statistical analysis of PI3K, p-Akt and Akt protein level (B-D). aP < 0.01 vs control treatment group.
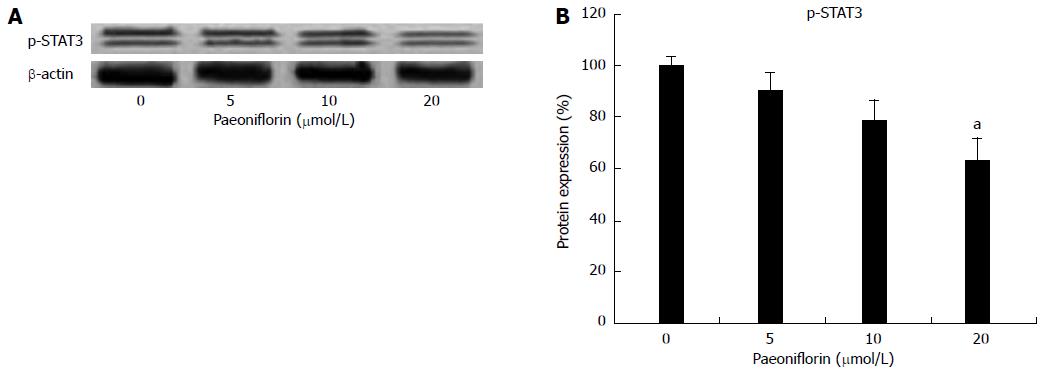
Figure 8 Paeoniflorin attenuates the expression of STAT3.
Indicated representative western blotting analysis of p-STAT3 protein levels (A) and statistical analysis of p-STAT3 protein level (B). aP < 0.01 vs control treatment group.
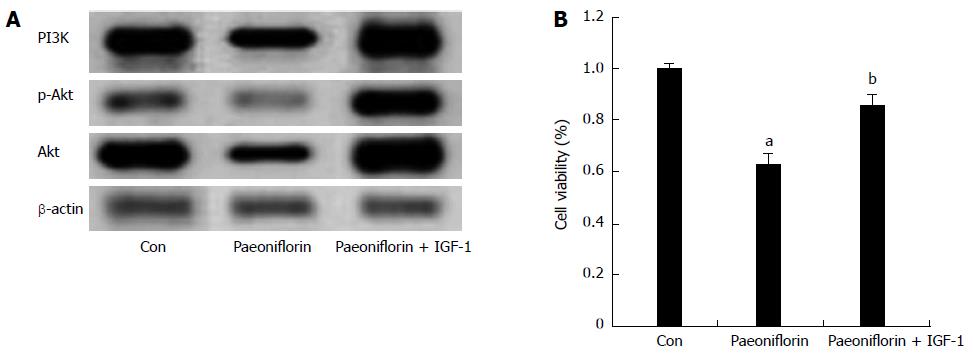
Figure 9 PI3K agonist inhibits the effect of paeoniflorin on cell proliferation.
Indicated representative western blotting analysis of PI3K, p-Akt and Akt protein levels (A) and paeoniflorin inhibits cell proliferation (B). aP < 0.01 compared with control treatment group, bP > 0.05 vs control treatment group.
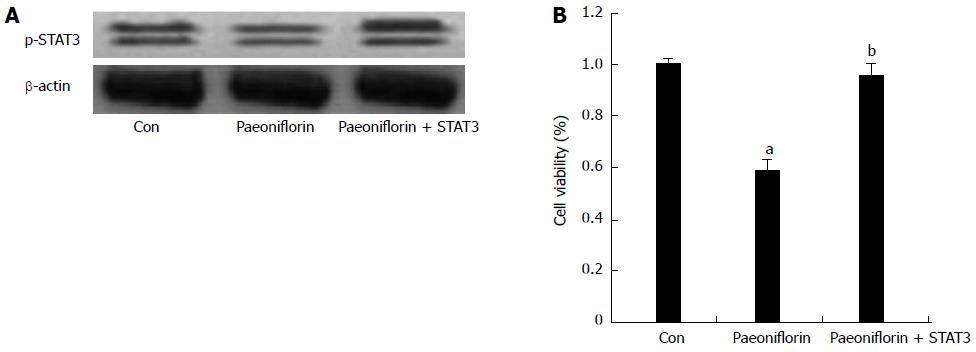
Figure 10 Overexpression of STAT3 inhibits the effect of paeoniflorin on cell proliferation.
Indicated representative western blotting analysis of p-STAT3 protein levels (A) and paeoniflorin inhibits cell proliferation (B). aP < 0.01 vs control treatment group, bP > 0.05 vs control treatment group.
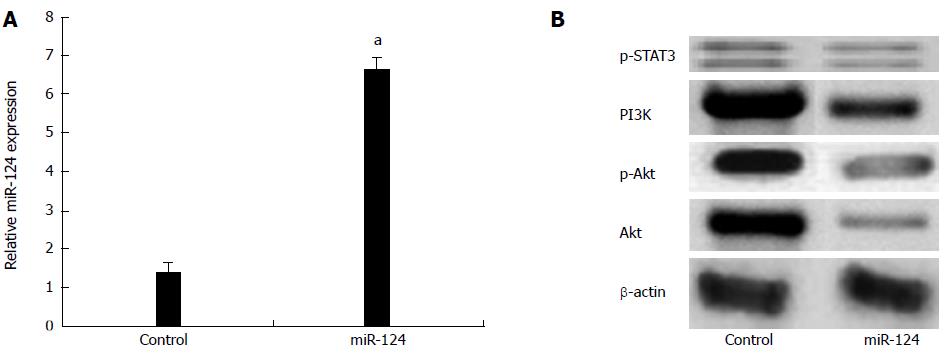
Figure 11 Overexpression of microRNA-124 and the expression of PI3K/Akt.
Overexpression of microRNA (miR)-124 can accelerate the expression of miR-124 (A); inhibit PI3K, p-Akt, Akt and p-STAT3 protein expression (B). aP < 0.01 vs 0 μmol/L paeoniflorin treatment group.
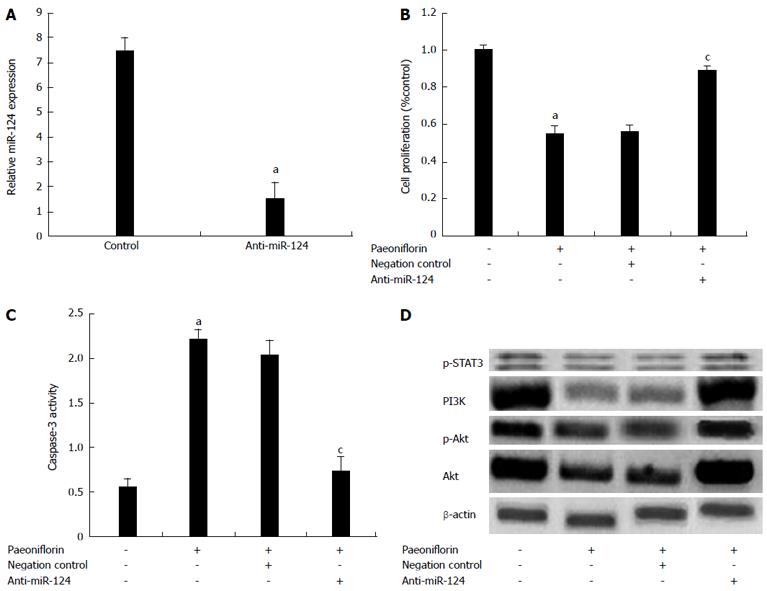
Figure 12 Anti-microRNA-124 and the effect of paeoniflorin.
Anti-microRNA (miR)-124 can reverse the effect of paeoniflorin on the expression of miR-124 in MGC-803 cells (A); After treatment with paeoniflorin (20 μmol/L) for 72 h, anti-miR-124 significantly promoted the cell proliferation of MGC-803 cells (B); After treatment with paeoniflorin (20 μmol/L) for 72 h, anti-miR-124 markedly inhibited cell apoptosis of MGC-803 cells (C); The anti-miR-124 significantly increased the expressions of PI3K, p-Akt, Akt and p-STAT3 protein in MGC-803 cells after paeoniflorin (20 μmol/L) treatment at 72 h (D). aP < 0.01 vs 0 μmol/L paeoniflorin treatment group and cP < 0.01 vs paeoniflorin-treated group transfected with negative control.
- Citation: Zheng YB, Xiao GC, Tong SL, Ding Y, Wang QS, Li SB, Hao ZN. Paeoniflorin inhibits human gastric carcinoma cell proliferation through up-regulation of microRNA-124 and suppression of PI3K/Akt and STAT3 signaling. World J Gastroenterol 2015; 21(23): 7197-7207
- URL: https://www.wjgnet.com/1007-9327/full/v21/i23/7197.htm
- DOI: https://dx.doi.org/10.3748/wjg.v21.i23.7197


