Copyright
©The Author(s) 2015.
World J Gastroenterol. Jun 14, 2015; 21(22): 7036-7046
Published online Jun 14, 2015. doi: 10.3748/wjg.v21.i22.7036
Published online Jun 14, 2015. doi: 10.3748/wjg.v21.i22.7036
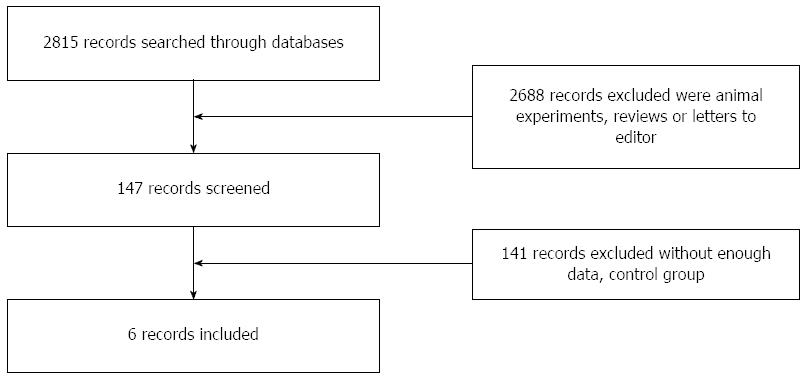
Figure 1 Flow diagram of the included studies.
Figure 2 Meta-analysis results of incidence of ischemic-type biliary lesions.
The occurrence of incidence of ischemic-type biliary lesions was significantly reduced in the SimR group over the SeqR group (OR = 4.97, 95%CI: 2.45-10.07, P < 0.00001). SeqR: Sequential revascularization; SimR: Simultaneous revascularization.
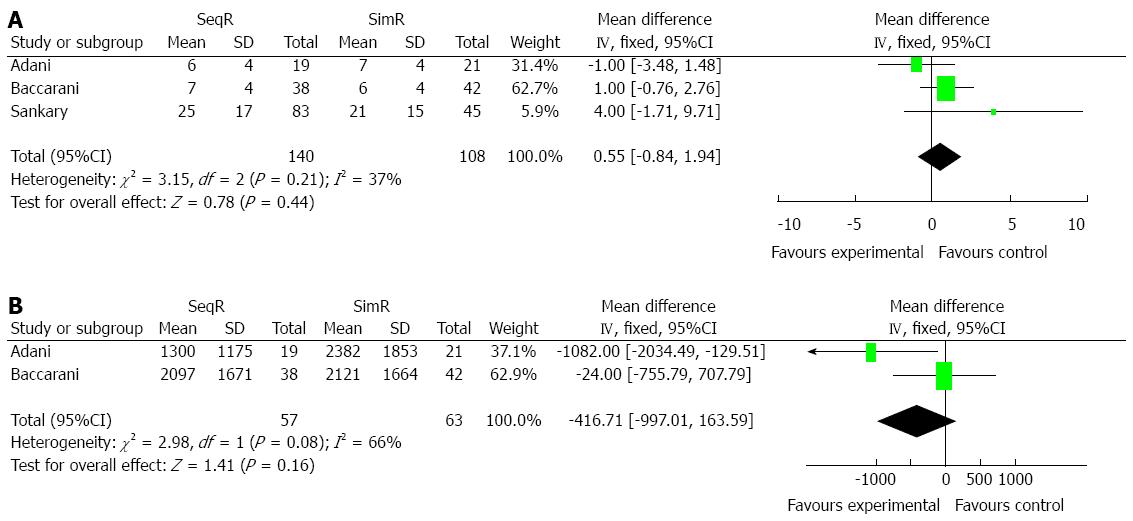
Figure 3 Meta-analysis results of blood cell and plasma transfusions.
A: Three studies were conducted to compare units of blood cell (MD = 0.55, 95%CI: -0.84-1.94, P = 0.44); B: Two studies were conducted to compare plasma transfusions (MD = -416.71, 95%CI: -997.01-163.59, P = 0.16).
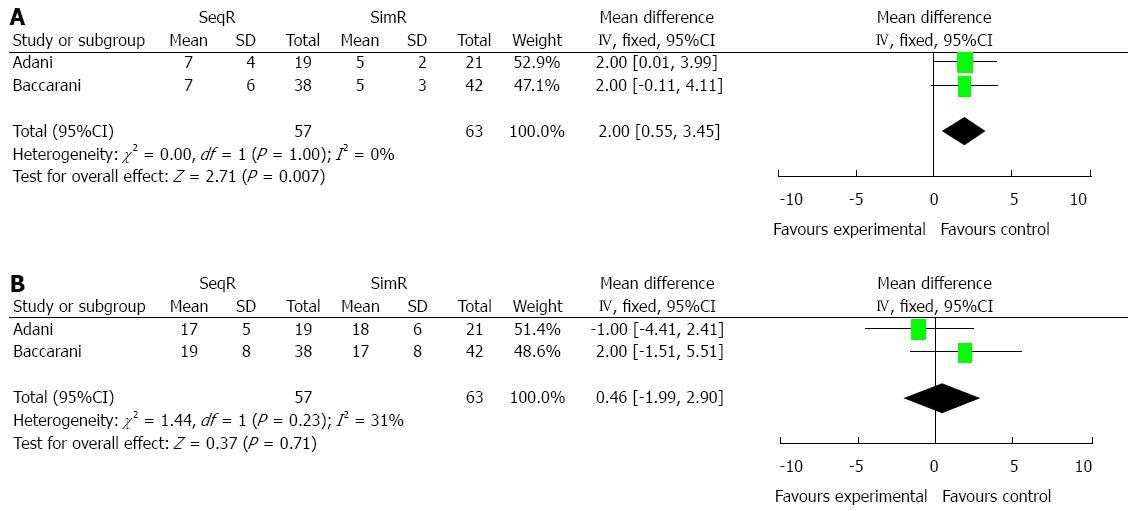
Figure 4 Meta-analysis results of intensive care unit and total hospital days.
A: SimR significantly decreased intensive care unit days (MD = 2.00, 95%CI: 0.55-3.45, P = 0.007); B: No significant difference was shown in total hospital days (MD = 0.46, 95%CI: -1.99-2.90, P = 0.71).
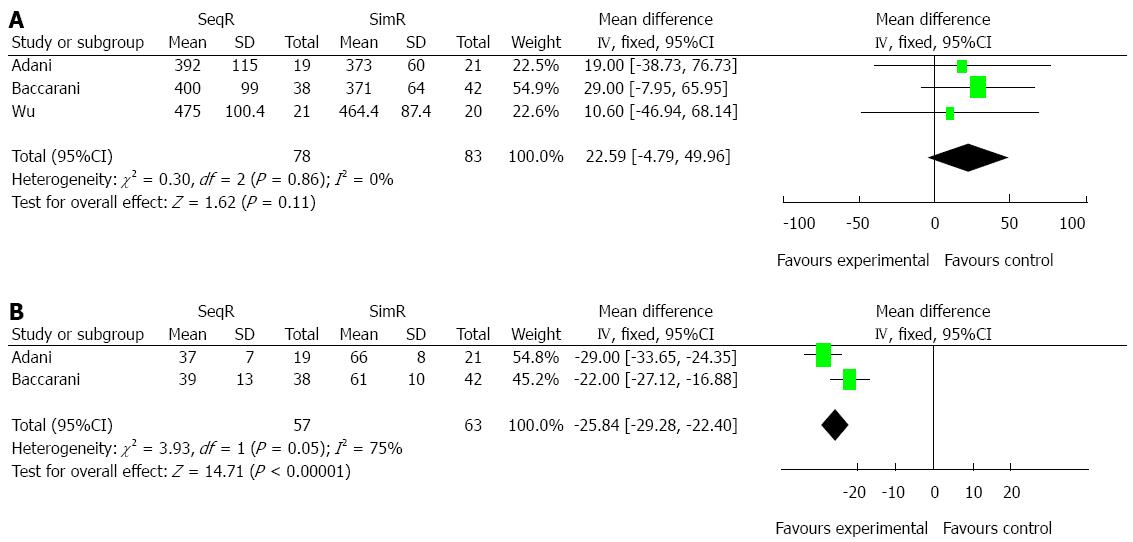
Figure 5 Meta-analysis results of total operation time and warm ischemia time.
A: There was no significant difference in total operation time (MD = 22.59, 95%CI: -4.79-49.96, P = 0.11); B: SimR significantly prolonged warm ischemia time (WIT) (MD = -25.84, 95%CI: -29.28-22.40, P < 0.00001). However, the results of χ2 and I2 tests in WIT showed heterogeneity (P = 0.05, I2 = 75%).
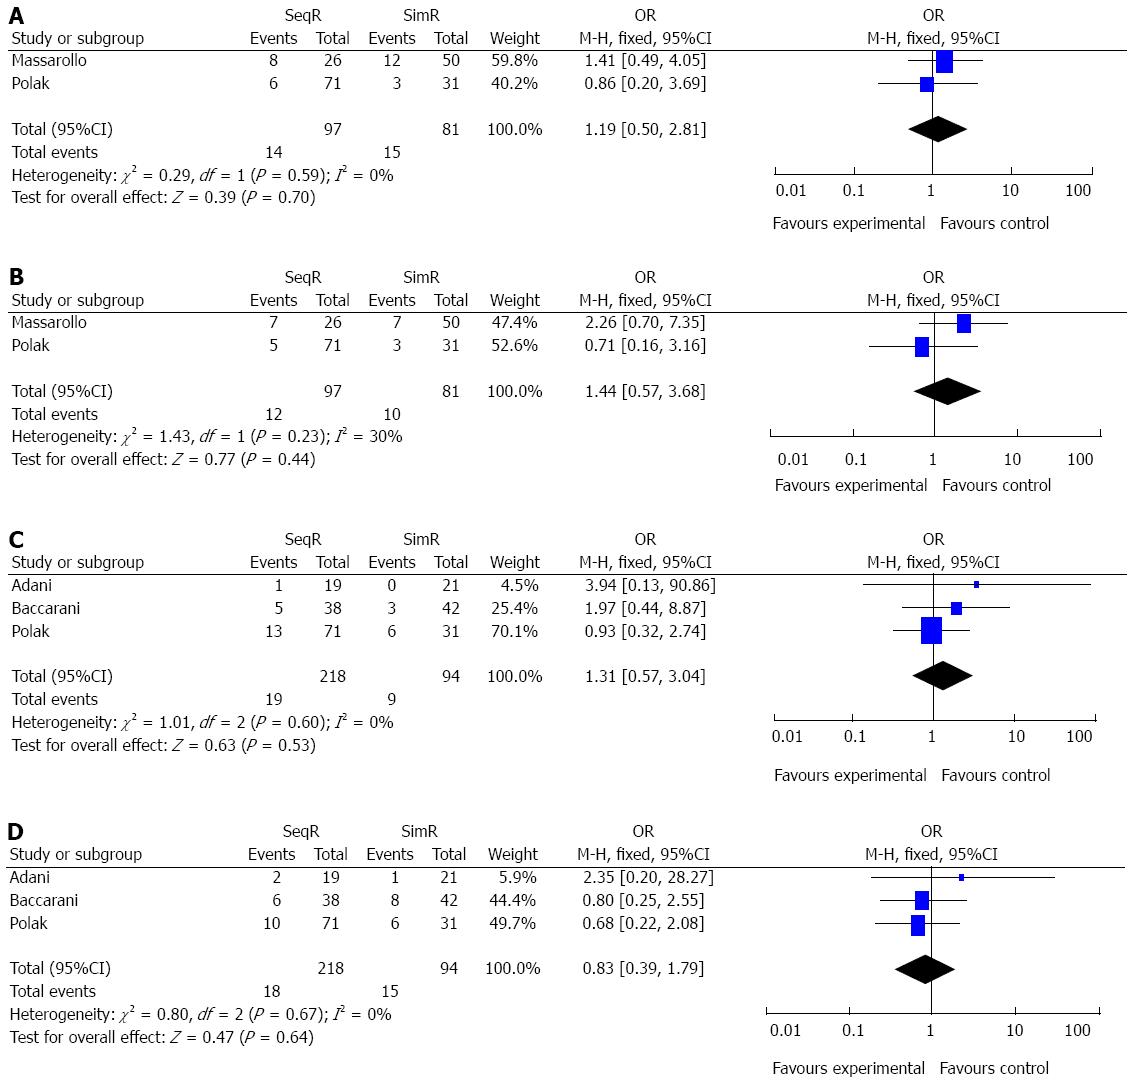
Figure 6 Meta-analysis results of graft failure and mortality in one month and one year.
A: There were no significant differences in graft failure in one month (OR = 1.19, 95%CI: 0.50-2.81, P = 0.70); B: There were no significant differences in mortality in one month (OR = 1.44, 95%CI: 0.57-3.68, P = 0.44); C: There were no significant differences in graft failure in one year (OR = 1.31, 95%CI: 0.57-3.04, P = 0.53); D: There were no significant differences in mortality in one year (OR = 0.83, 95%CI: 0.39-1.78, P = 0.64).
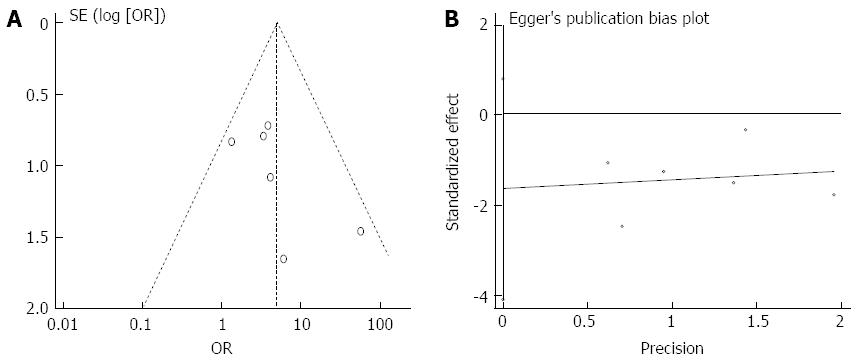
Figure 7 Funnel plot and Egger’s test of studies on incidence of ischemic-type biliary lesions.
A: Funnel plot was not strictly symmetrical; B: Egger’s test did not show publication bias (P = 0.136).
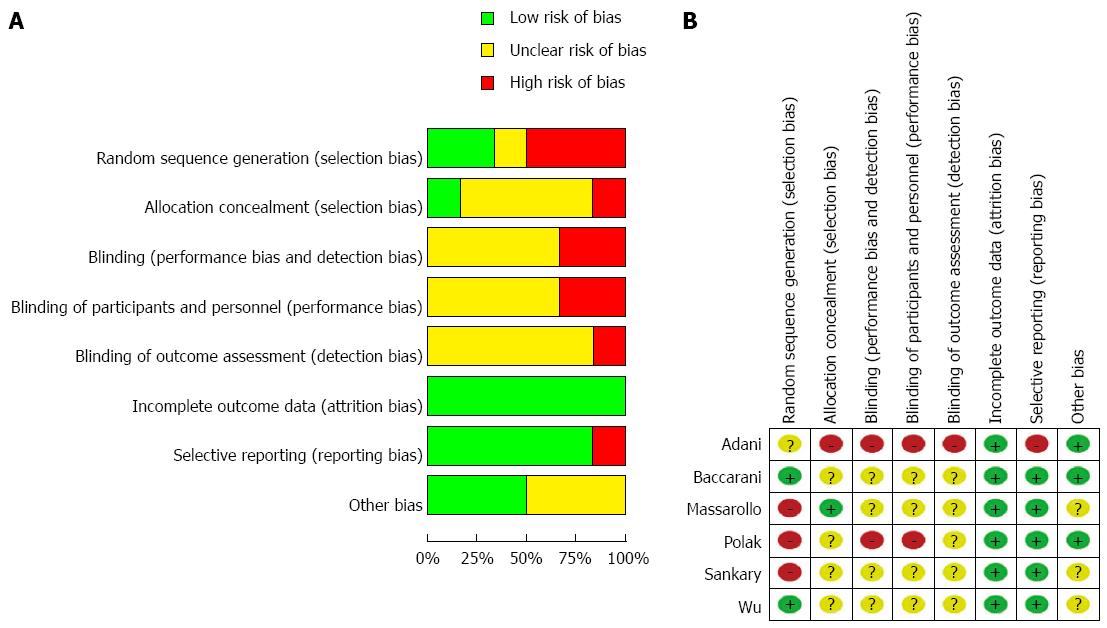
Figure 8 Risk of bias graph: review authors’ judgments regarding each risk of bias item for each included study.
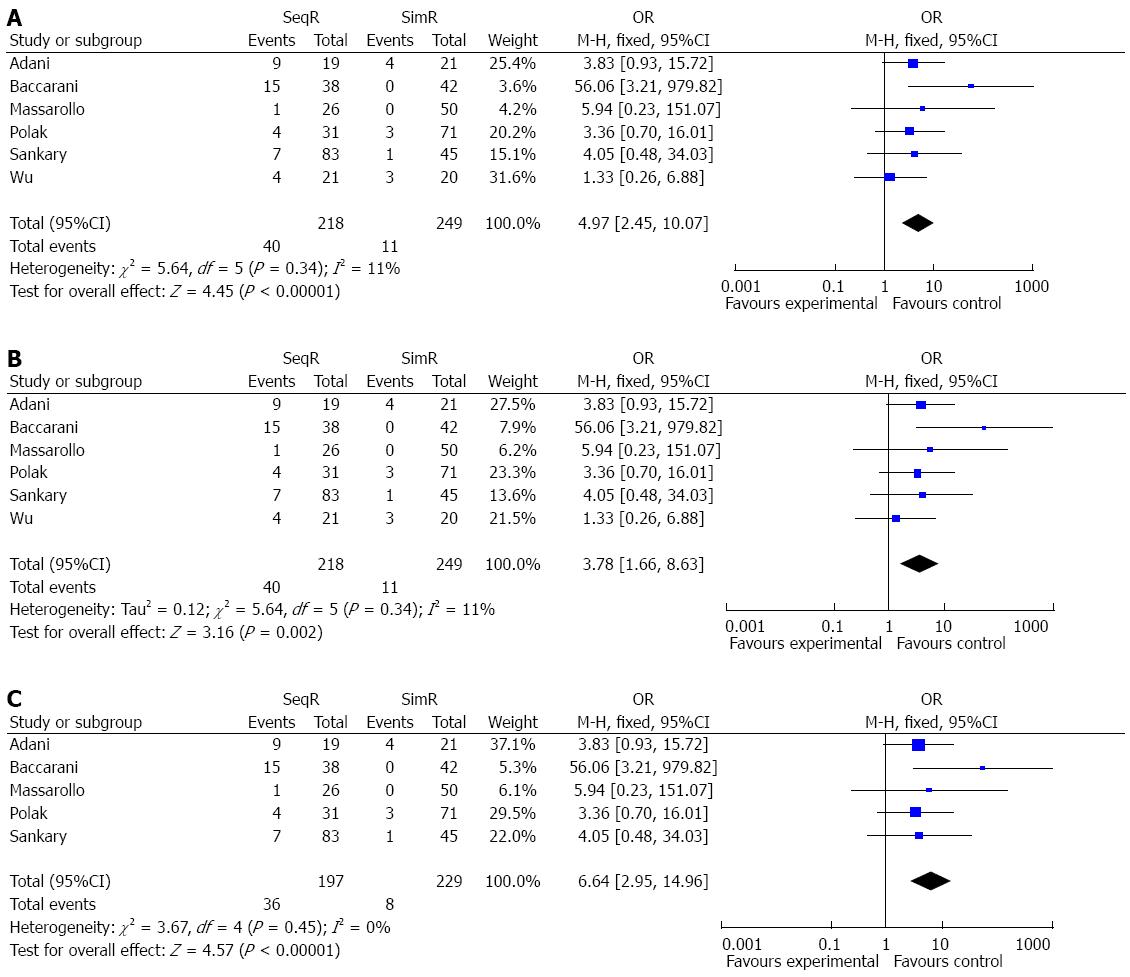
Figure 9 Sensitivity analysis of this meta-analysis.
The sensitivity analysis showed the same effect sizes among different models. A: A fixed effects model (P < 0.00001); B: A random effects model (P = 0.002); C: A fixed effects model after excluding the greatest weight study (P < 0.00001).
-
Citation: Wang JZ, Liu Y, Wang JL, Lu L, Zhang YF, Lu HW, Li YM. Sequential
vs simultaneous revascularization in patients undergoing liver transplantation: A meta-analysis. World J Gastroenterol 2015; 21(22): 7036-7046 - URL: https://www.wjgnet.com/1007-9327/full/v21/i22/7036.htm
- DOI: https://dx.doi.org/10.3748/wjg.v21.i22.7036


