Copyright
©The Author(s) 2015.
World J Gastroenterol. Jun 14, 2015; 21(22): 6990-6998
Published online Jun 14, 2015. doi: 10.3748/wjg.v21.i22.6990
Published online Jun 14, 2015. doi: 10.3748/wjg.v21.i22.6990
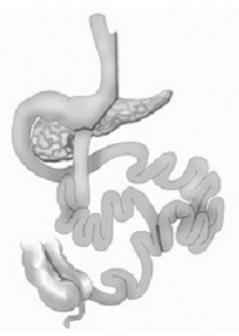
Figure 1 Sleeve gastrectomy with transit bipartition.
At 180 cm proximal to the ileocecal valve, the ileum is anastomosed to the gastric antrum. The biliopancreatic segment is anastomosed to the ileum 80 cm proximal to the ileocecal valve.
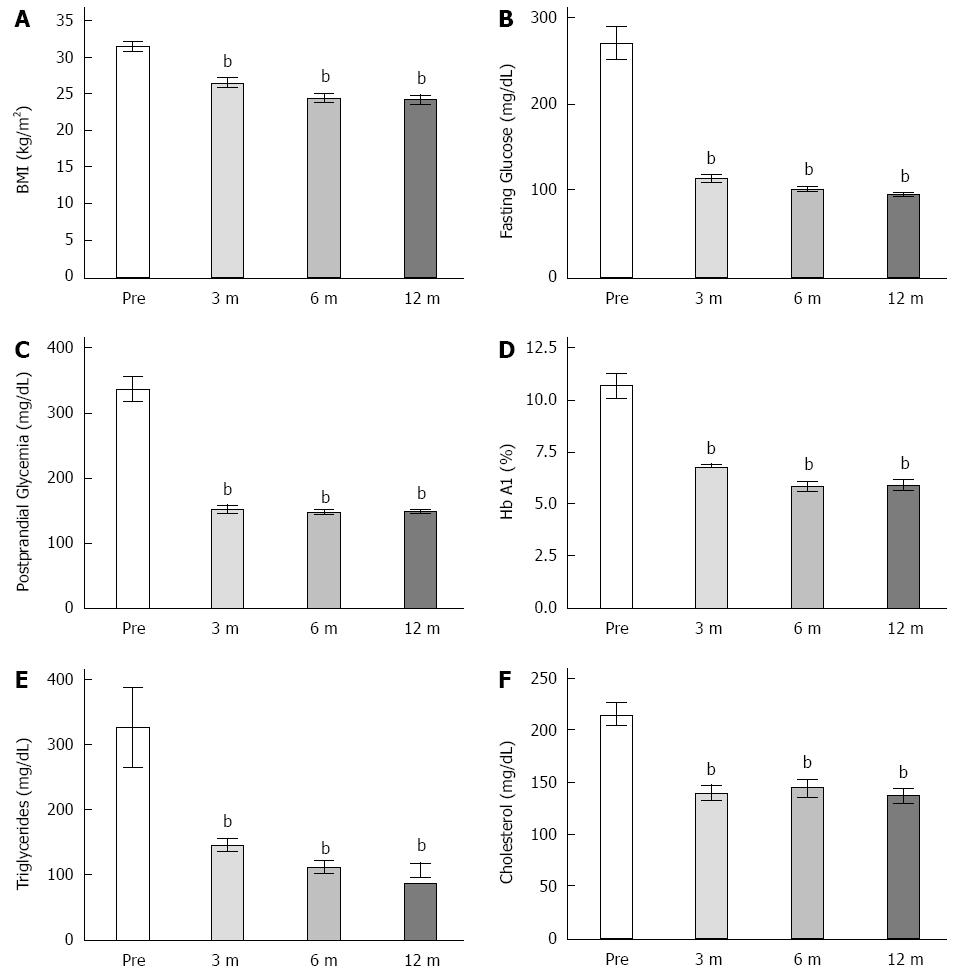
Figure 2 Changes in metabolic parameters following sleeve gastrectomy with transit bipartition in patients with type 2 diabetes mellitus.
A: Body mass index; B: Fasting glycemia; C: Postprandial glycemia; D: Hemoglobin A1c; E: Plasma triglycerides; F: Plasma total cholesterol. The gray bars show data before the sleeve gastrectomy with transit bipartition (SGTB), and the black bars show data after the surgery (n = 9). Data are expressed as the mean ± SEM. bP < 0.01 vs Pre. Pre: Pre-surgery; 3 m: 3 mo post-surgery; 6 m: 6 mo post-surgery; 12 m: 12 mo post-surgery.
Figure 3 Changes in gastric inhibitory polypeptide and glucagon-like peptide-1 levels following sleeve gastrectomy with transit bipartition in patients with type 2 diabetes mellitus.
A: Area under the curve (AUC) for the plasma glucagon-like peptide-1 levels pre- and post-surgery while fasting and after ingesting a standard meal (520 kcal). Blood samples were collected 30, 60, 90, and 120 min after the meal; B: Sum of the individual AUCs of plasma gastric inhibitory polypeptide levels pre- and post-surgery while fasting and after ingesting a standard meal (520 kcal). Blood samples were collected 30, 60, 90, and 120 min after the meal. Data are expressed as the mean ± SE. aP < 0.05 vs Pre. Pre: Pre-surgery; Post: Post-surgery.
Figure 4 Gene expression profile of p53 in the intestinal mucosa before and after sleeve gastrectomy with transit bipartition in patients with type 2 diabetes mellitus.
A: p53 mRNA expression in the duodenum; B: p53 mRNA expression in the ileum. The gray bars show data before the gastrectomy with transit bipartition, and the black bars show data 3 mo postoperatively. Data are expressed as the mean ± SE. aP < 0.05 vs Pre. Pre: Pre-surgery; Post: Post-surgery.
Figure 5 Gene expression profile of transforming growth factor tumor growth factor-β in the intestinal mucosa before and after sleeve gastrectomy with transit bipartition in patients with type 2 diabetes mellitus.
A: Tumor growth factor-β (TGF-β) mRNA expression in the duodenum; B: TGF-β mRNA expression in the ileum. The gray bars show data before the sleeve gastrectomy with transit bipartition (SGTB), and the black bars show data 3 mo postoperatively. Data are expressed as the mean ± SE. aP < 0.05 vs Pre. Pre: Pre-surgery; Post: Post-surgery.
- Citation: Rodrigues MRDS, Santo MA, Favero GM, Vieira EC, Artoni RF, Nogaroto V, Moura EG, Lisboa P, Milleo FQ. Metabolic surgery and intestinal gene expression: Digestive tract and diabetes evolution considerations. World J Gastroenterol 2015; 21(22): 6990-6998
- URL: https://www.wjgnet.com/1007-9327/full/v21/i22/6990.htm
- DOI: https://dx.doi.org/10.3748/wjg.v21.i22.6990


