Copyright
©The Author(s) 2015.
World J Gastroenterol. Jun 14, 2015; 21(22): 6872-6883
Published online Jun 14, 2015. doi: 10.3748/wjg.v21.i22.6872
Published online Jun 14, 2015. doi: 10.3748/wjg.v21.i22.6872
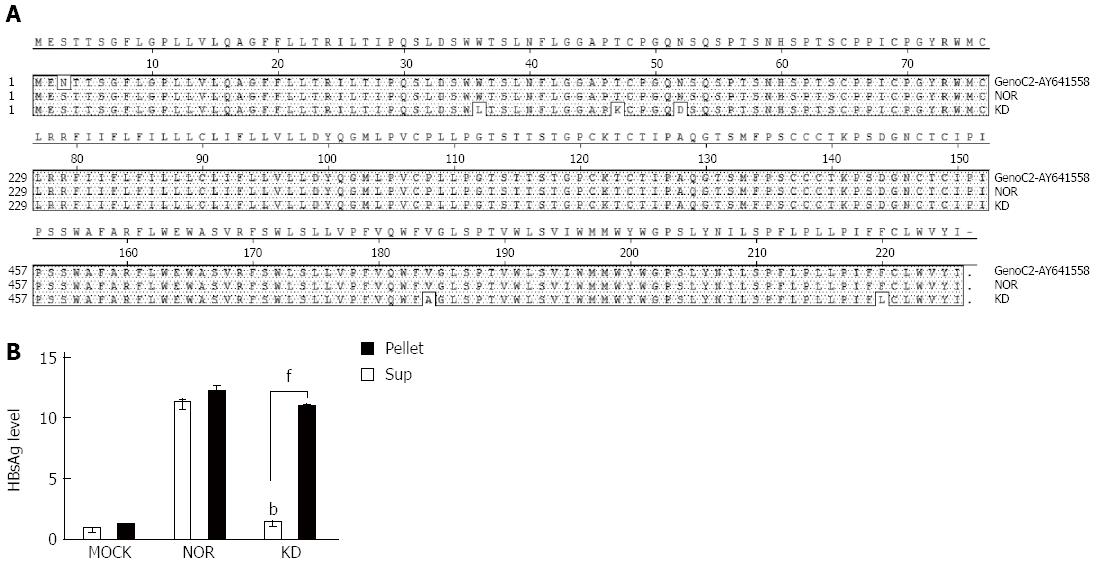
Figure 1 Mutation patterns of hepatitis B virus S surface antigen variant (KD) related to occult infection and a wild-type hepatitis B virus S surface antigen (NOR) and comparisons of secretory and intracellular S surface antigen levels using hepatitis B virus S surface antigen ELISAs.
Sequence variations were compared between wild-type (NOR) and KD variant (W36L, T47K, N52D, V184A, and F220L) HBsAg using the MegAlign software program (DNASTAR, Wisconsin, United States) (A). Secretory and intracellular HBsAg levels after transient transfection of plasmids (MOCK, NOR, and KD) into HuH-7 cells were measured using the HBsAg ELISA assay (B). All data are expressed as the mean ± SD within a group. bP < 0.01 vs NOR supernatant; fP < 0.01 vs supernatant and pellet.
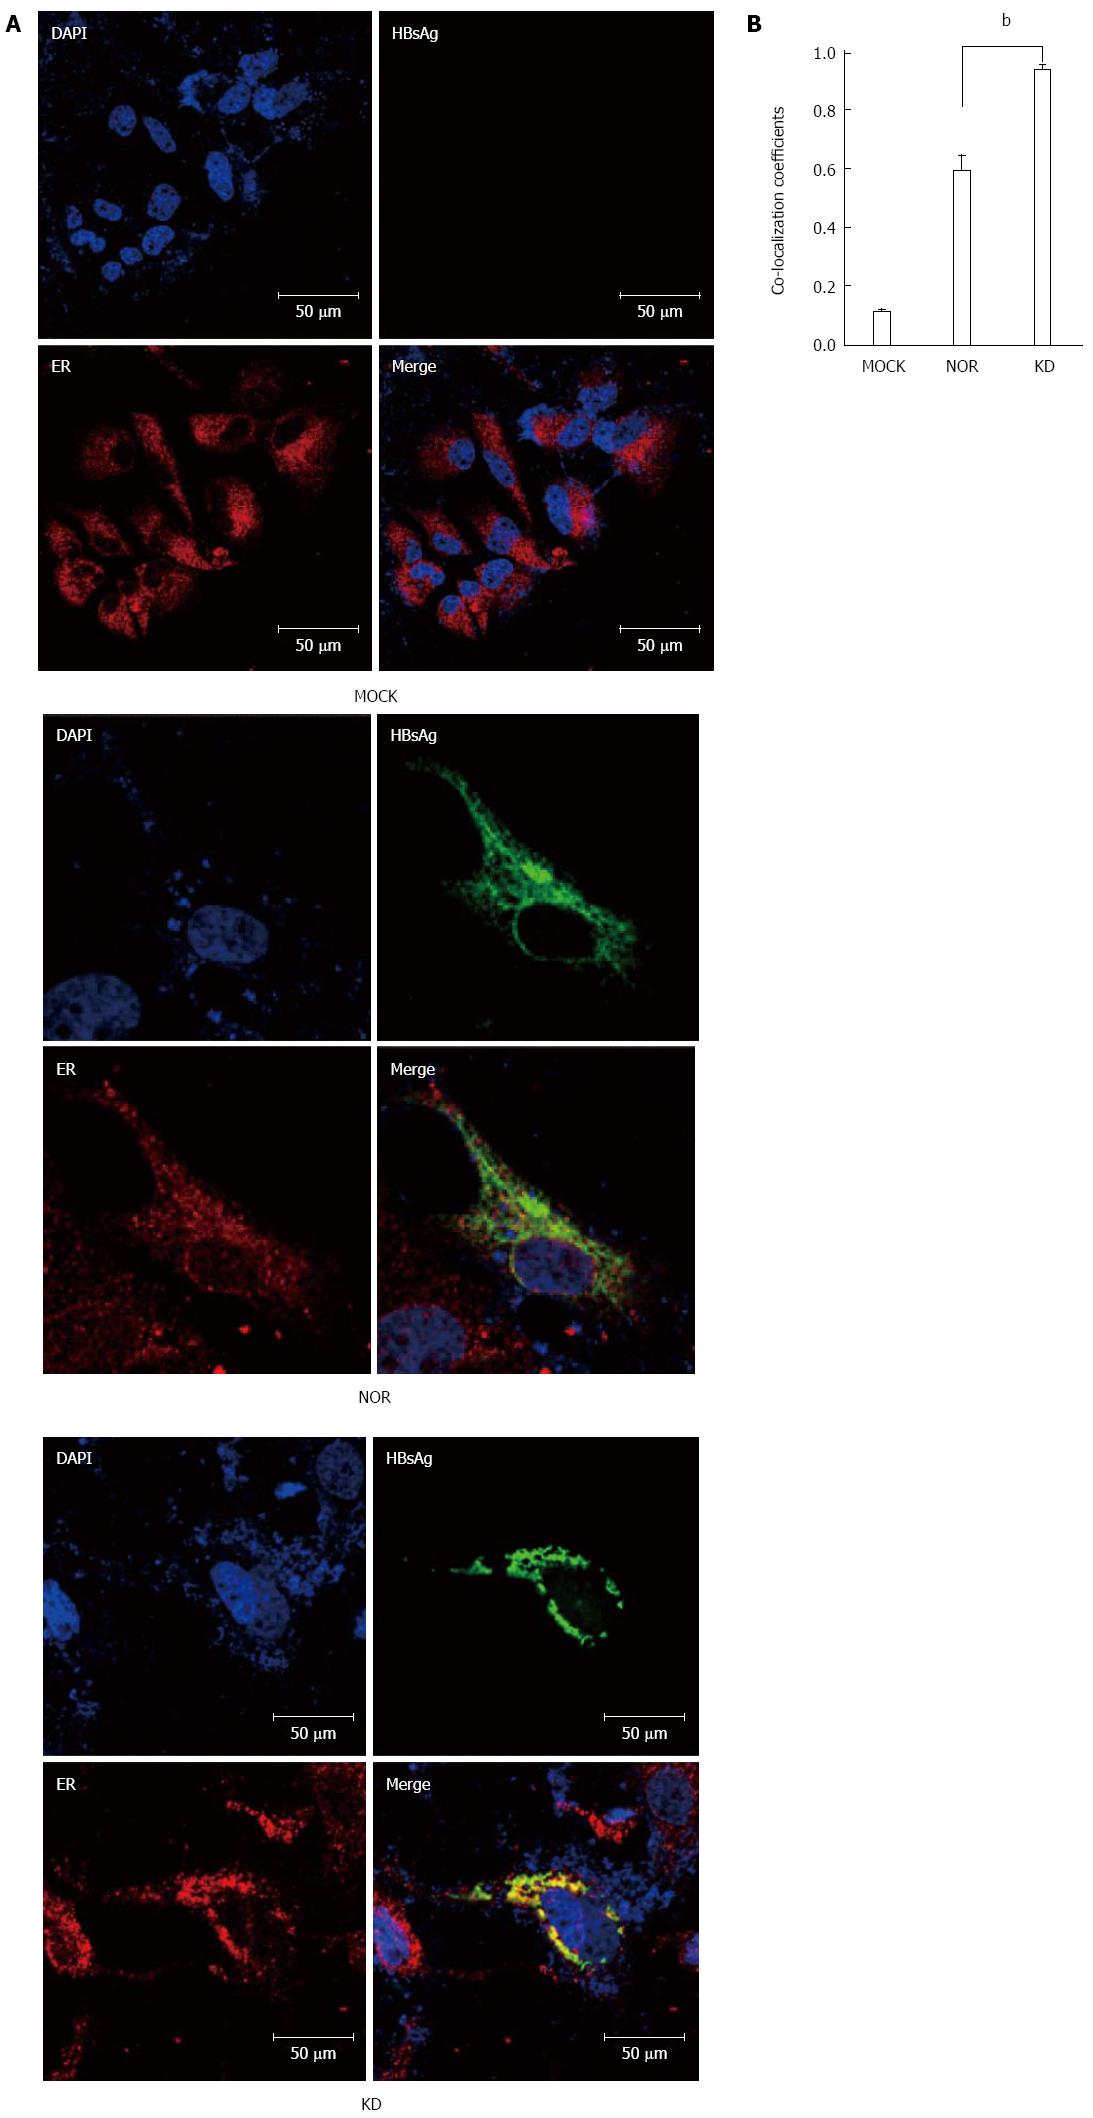
Figure 2 Comparisons of co-localization signals of endoplasmic reticulum and a hepatitis B virus S surface antigen variant (KD) and wild-type hepatitis B virus S surface antigen (NOR) using confocal microscopy.
A: Colocalization of the KD HBsAg variant (KD) and wild-type HBsAg (Nor) in the ER was visualized using confocal microscopy (Confocal A1, Nikon, Japan) after immunofluorescence double-staining assays. HuH-7 cells were transiently transfected with an empty vector (pIRES2-EGFP-Mock) or two different small hepatitis B virus S surface antigen (HBsAg) protein expression vectors (pIRES2-EGFP-Wild-type, pIRES2-EGFP-KD). Cells were harvested 2 d post-transfection, fixed with 4% paraformaldehyde, and stained for HBsAg (green) and the ER marker calnexin (red). The blue color of the nucleus is DAPI staining. Scale bars represent 10, 20, and 50 μm; B: Colocalizations of the HBsAgs and ER in the cytoplasm were compared to each other using co-localization coefficients according to the lasso ROI selection. Statistical comparisons were performed using one-way ANOVA. The average of the coefficients of ten images examined in a double-blinded manner is shown. (bP < 0.01 vs control).
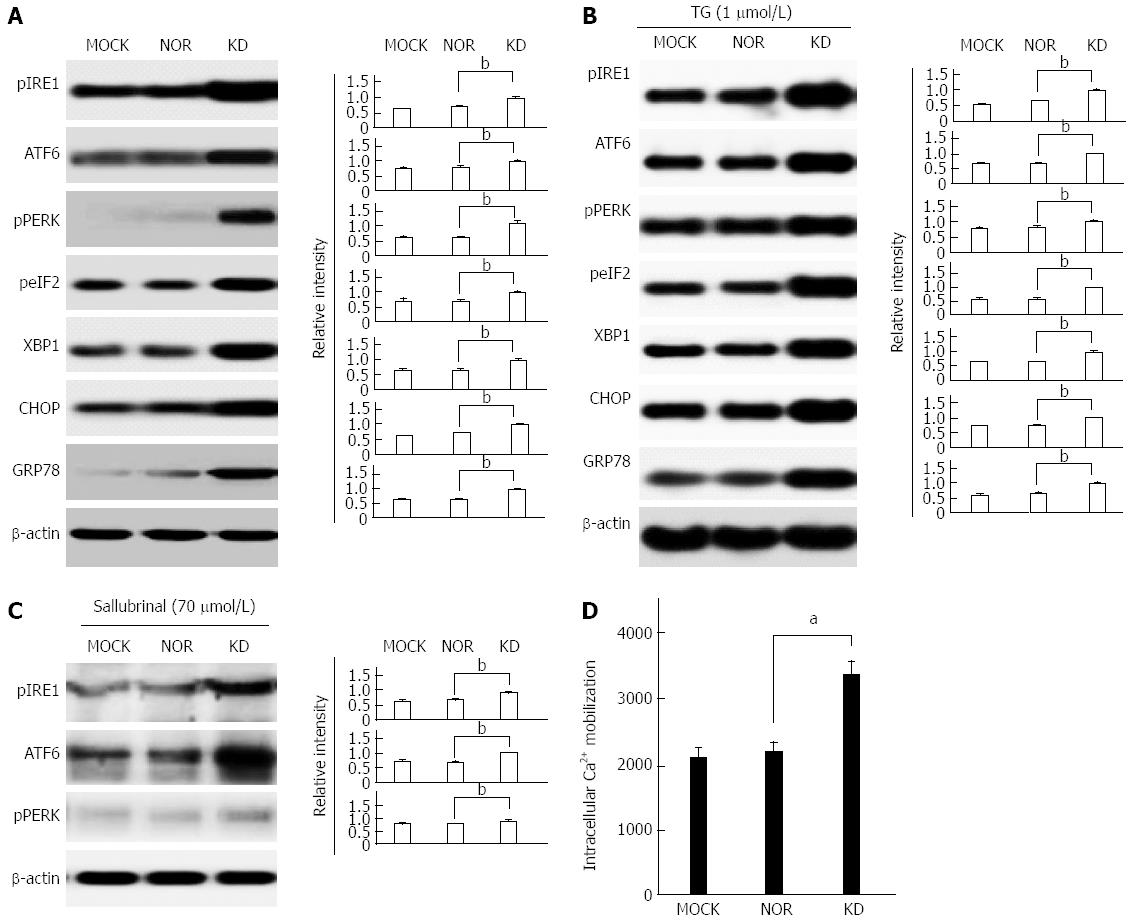
Figure 3 Induction of endoplasmic reticulum stress and intracellular calcium levels by an occult infection related hepatitis B virus S surface antigen variant (KD).
After transient transfection of plasmids (MOCK, NOR, and KD) into HuH-7 cells, up-regulation of the seven main endoplasmic reticulum (ER) stress-related proteins, namely, IRE1, ATF6, PERK, elF2, XBP1, CHOP, and GRP 78, was confirmed using Western blot in the absence (A) and presence (B) of 1 μmol/L thapsigargin (TG); C: Effect of the ER stress inhibitor salubrinal (70 μmol/L) on HBsAg variant-induced activation of ER stress-related proteins (IRE1, ATF6, and PERK). D: After transient transfection, Ca2+ was measured using Rhod-2-AM. The mean values are presented in the graphic (all data were confirmed using green fluorescent protein and Western blot to determine transfection efficiency). The relative intensity was determined, and all data are expressed as the mean ± SD within a group. Data from the three experiments were compared using Tukey’s multiple post-hoc test (aP < 0.05, bP < 0.01 vs control).
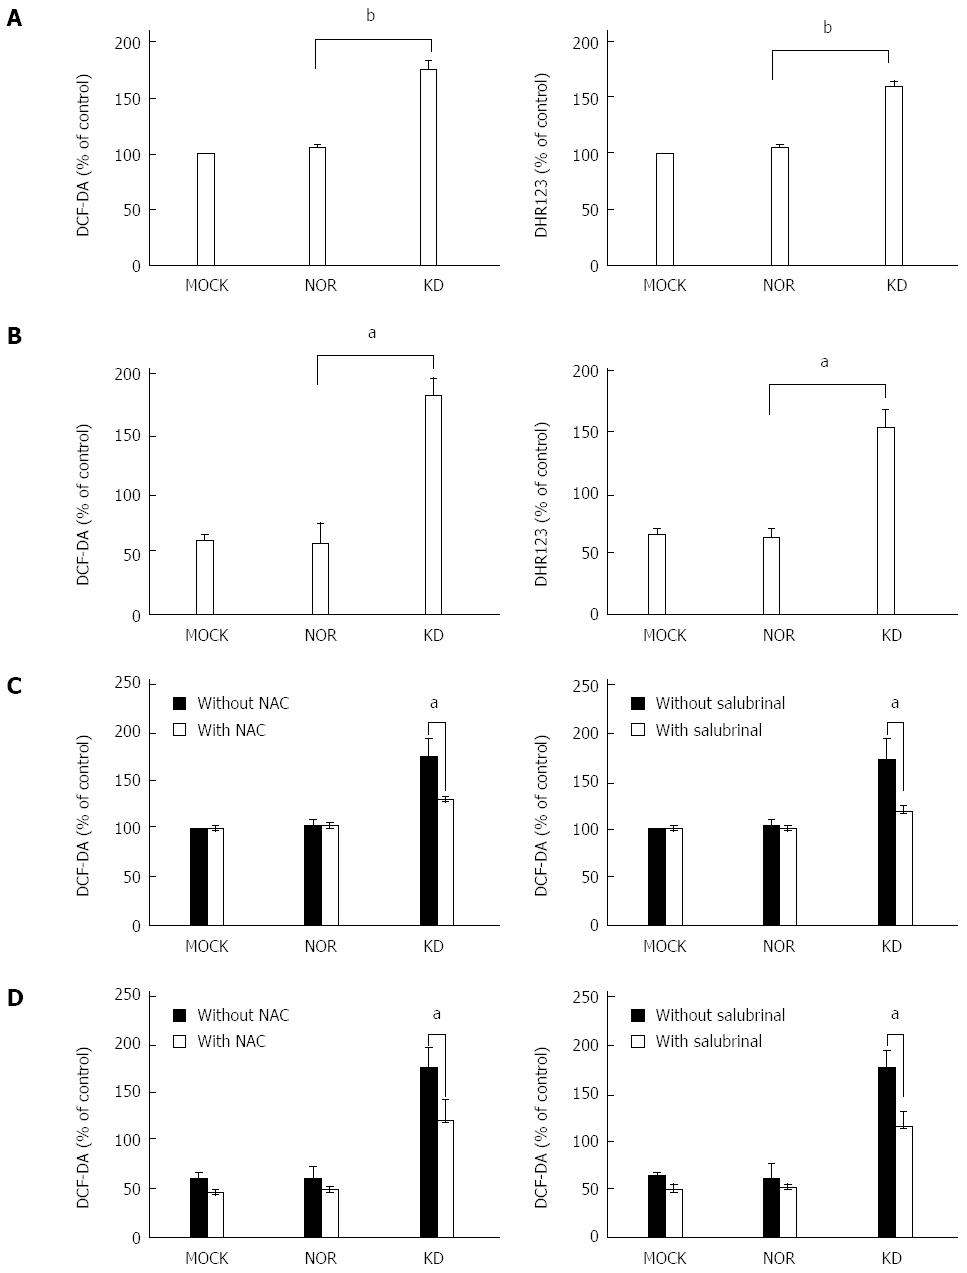
Figure 4 Reactive oxygen species generation by an occult infection related hepatitis B virus S surface antigen variant, KD.
Final concentrations (25 μmol/L) of DCF-DA and DHR123 were incubated for 20 min after transient transfection of plasmids (MOCK, NOR, and KD) into HuH-7 cells to assess mitochondrial and intracellular ROS levels. Results were determined using luminescence spectrometry (A) or FACS (B). The mean values of the experiments are presented in the graphic. The effects of the ROS inhibitor NAC (40 mmol/L) and the ER stress inhibitor salubrinal (70 μmol/L) on ROS generation were evaluated using DCF-DA and luminescence spectrometry (C) or FACS (D). All experiments were performed in triplicate. The relative intensity was determined, and all data are expressed as the means ± SD within a group. Data from the three experiments were compared using Tukey’s multiple post-hoc test (aP < 0.05, bP < 0.01 vs control).
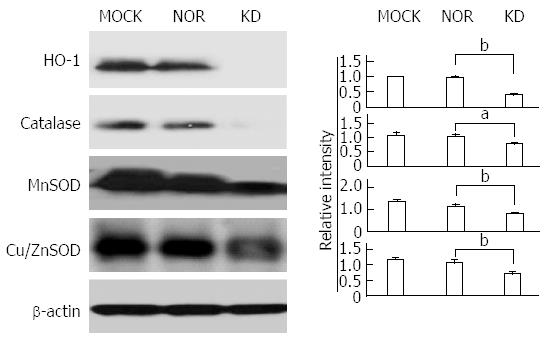
Figure 5 Down-regulation of anti-oxidant proteins by an occult infection related to an S surface antigen variant (KD).
After transient transfection of plasmids (MOCK, NOR, and KD) into HuH-7 cells, the down-regulation of four anti-oxidant proteins, MnSOD, CuZnSOD, HO-1, and catalase in the KD variant was confirmed using Western blot. The results of the KD variant contrasted MOCK and NOR. The relative intensity values were determined, and all data are expressed as the mean ± SD within a group. The three experiments were compared using Tukey’s multiple post-hoc test (aP < 0.05, bP < 0.01 vs three experiments).
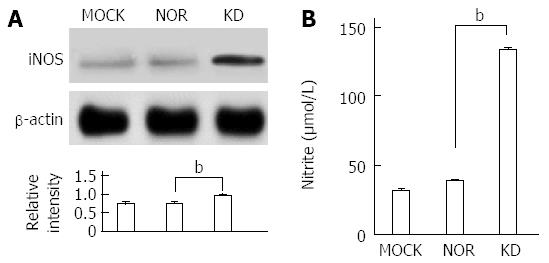
Figure 6 Nitric oxide increase via up-regulation of iNOS expression by a hepatitis B virus S surface antigen variants (KD).
A: After transient transfection of plasmids (MOCK, NOR, and KD) into HuH-7 cells, up-regulation of iNOS expression was observed in the KD variant compared to the MOCK and NOR. The relative intensity was determined, and all data are expressed as the mean ± SD within a group. The three experiments were compared using Tukey’s multiple post-hoc test (bP < 0.01 vs three experiments); B: After transient transfection, NO levels were assessed using a nitric oxide (NO) ELISA (Assay Designs, MI, United States). NO levels in the KD HBsAg variant increased significantly compared to the MOCK and NOR. The relative intensity was determined, and all data are expressed as the mean ± SD within a group. The three experiments were compared using Tukey’s multiple post-hoc test (bP < 0.01 vs three experiments).
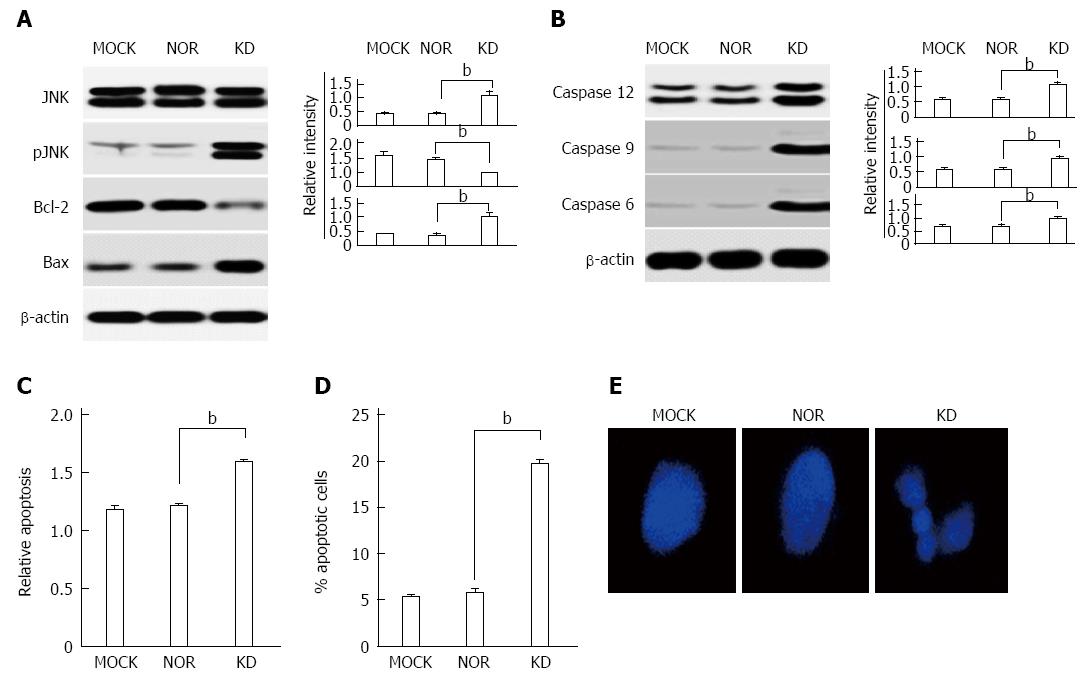
Figure 7 Apoptosis induction by an occult infection related hepatitis B virus S surface antigen variant (KD).
A: After transient transfection of plasmids (MOCK, NOR, and KD) into HuH-7 cells, up-regulation of p-JNK and the pro-apoptotic proteins Bax and down-regulation of the anti-apoptotic protein Bcl-2 were observed in the KD HBsAg variant compared to the MOCK and NOR. These results were confirmed using Western blot; B: After transfection, up-regulation of apoptosis-related caspase proteins (caspases 6, 9, and 12) was observed in the KD HBsAg variant compared to the MOCK and NOR. Apoptosis induction in the KD variant was demonstrated using a DNA Fragmentation Assay and the Cell Death Detection ELISAPLUS kit (Roche, Mannheim, Germany); C: PI staining using FACS. Morphological identification (D) of DNA fragmentation (E). The relative intensity values were determined, and all data are expressed as the mean ± SD within a group. The three experiments were compared using Tukey’s multiple post-hoc test (bP < 0.01 vs three experiments).
- Citation: Lee IK, Lee SA, Kim H, Won YS, Kim BJ. Induction of endoplasmic reticulum-derived oxidative stress by an occult infection related S surface antigen variant. World J Gastroenterol 2015; 21(22): 6872-6883
- URL: https://www.wjgnet.com/1007-9327/full/v21/i22/6872.htm
- DOI: https://dx.doi.org/10.3748/wjg.v21.i22.6872


