Copyright
©The Author(s) 2015.
World J Gastroenterol. Jun 7, 2015; 21(21): 6736-6744
Published online Jun 7, 2015. doi: 10.3748/wjg.v21.i21.6736
Published online Jun 7, 2015. doi: 10.3748/wjg.v21.i21.6736
Figure 1 1H magnetic resonance spectroscopy ROI area.
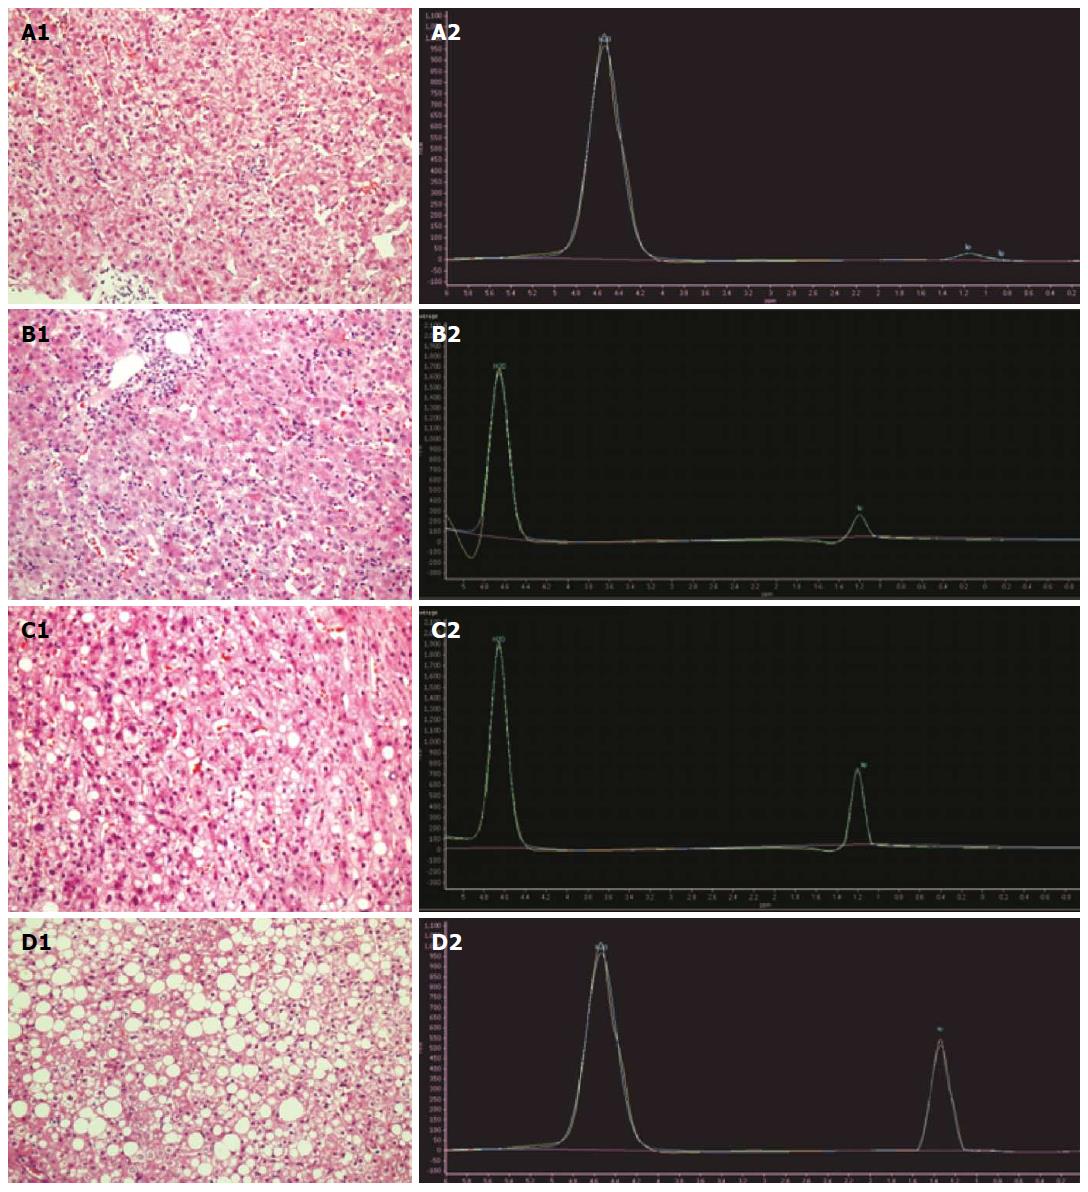
Figure 2 1H magnetic resonance spectroscopy spectrum characteristics for different fatty liver pathological levels.
MRS shows short a low fat peak in the no fatty liver group (A1, A2); In mild fatty liver pathological images (B1), lipid droplets increased slightly [hematoxylin-eosin (HE), magnification × 200]; 1H magnetic resonance spectroscopy (1H MRS) for mild fatty liver showed a slightly increased fat peak (B2); In moderate fatty liver pathological images (C1), lipid drops relatively increased compared with mild fatty liver (HE, magnification × 200); 1H MRS for moderate fatty liver showed a significantly higher fat peak (C2); In severe fatty liver pathological images (D1), the full field distribution of large bubble lipid droplets (HE, magnification × 200); 1H-MRS for severe fatty liver showed a significantly higher fat peak close to the water peak (D2).
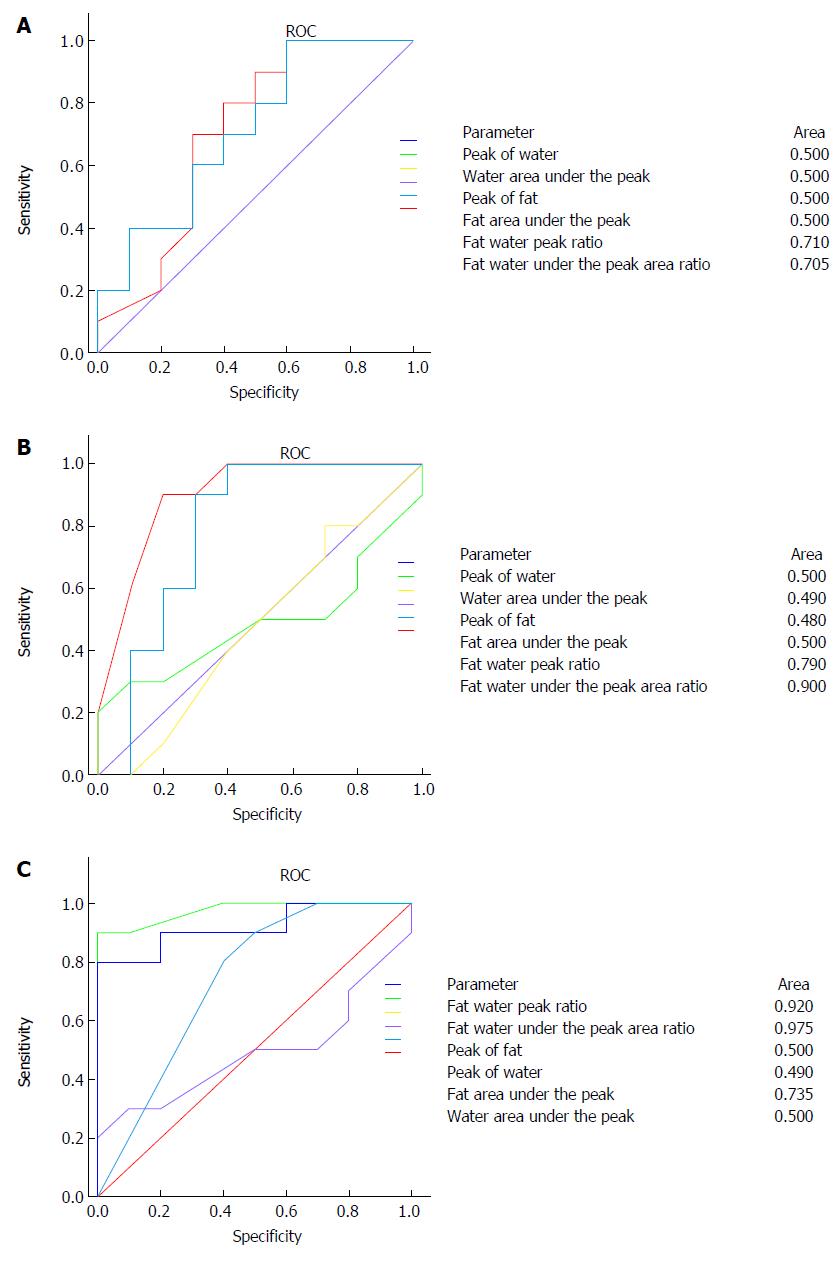
Figure 3 1H magnetic resonance spectroscopy of different groups of nonalcoholic fatty liver disease.
A: 1H magnetic resonance spectroscopy (1H MRS) of no vs mild fatty liver groups; B: 1H MRS of mild vs moderate fatty liver groups; C: 1H MRS of moderate vs severe fatty liver groups.
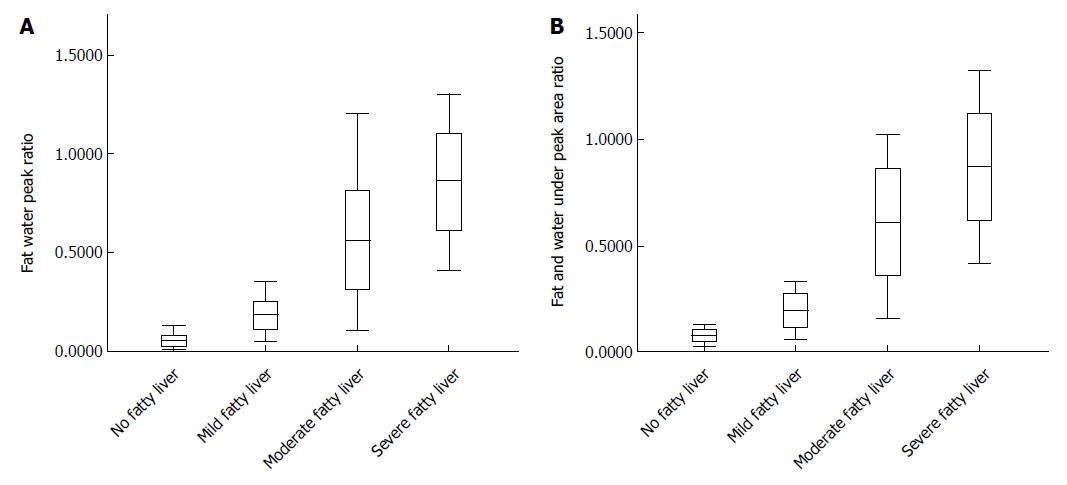
Figure 4 1H magnetic resonance spectroscopy fat water peak ratio and fat under water peak area ratio in different degrees of fatty liver (A, B).
- Citation: Zhang Q, Zhang HM, Qi WQ, Zhang YG, Zhao P, Jiao J, Wang JB, Zhang CY. 3.0T 1H magnetic resonance spectroscopy for assessment of steatosis in patients with chronic hepatitis C. World J Gastroenterol 2015; 21(21): 6736-6744
- URL: https://www.wjgnet.com/1007-9327/full/v21/i21/6736.htm
- DOI: https://dx.doi.org/10.3748/wjg.v21.i21.6736


