Copyright
©The Author(s) 2015.
World J Gastroenterol. Jun 7, 2015; 21(21): 6684-6697
Published online Jun 7, 2015. doi: 10.3748/wjg.v21.i21.6684
Published online Jun 7, 2015. doi: 10.3748/wjg.v21.i21.6684
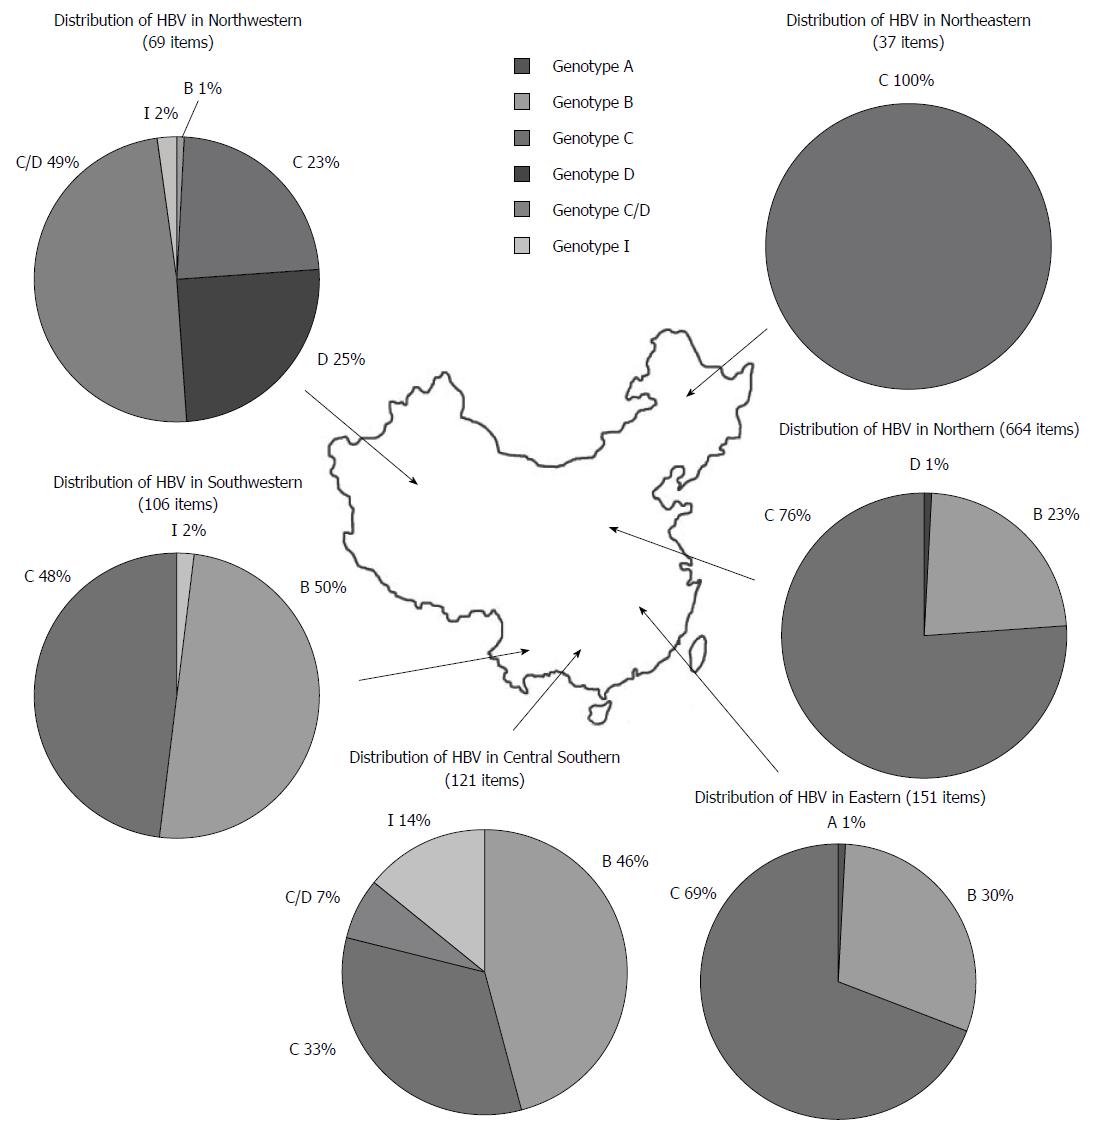
Figure 1 Distribution of hepatitis B virus genotypes in China.
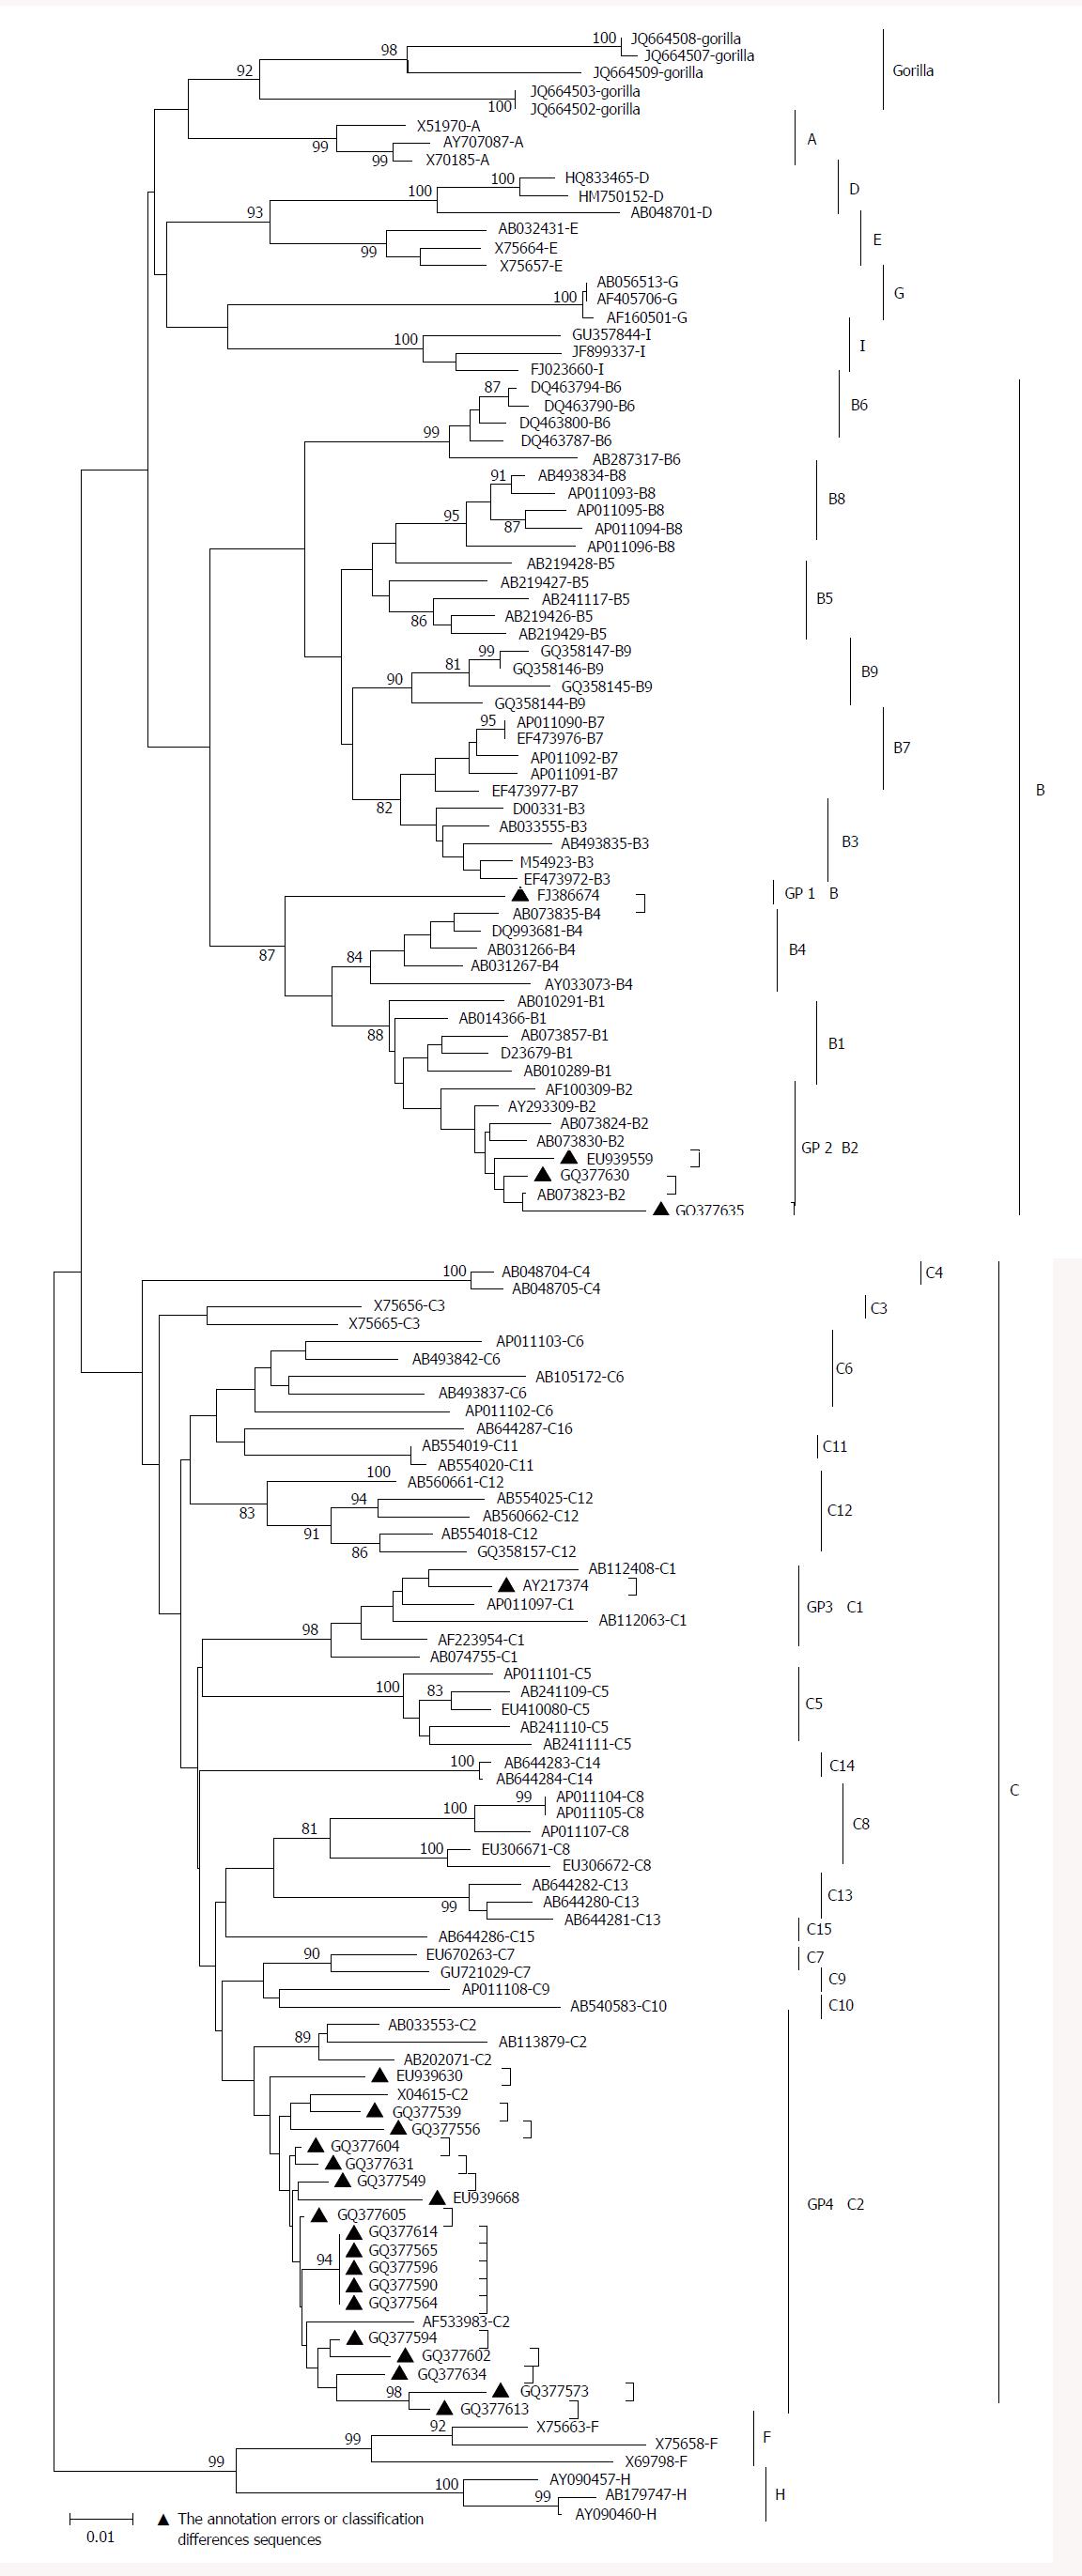
Figure 2 Hepatitis B virus sequences with controversial genotype and/or sub-genotype analysis with phylogenetic tree.
The evolutionary tree reference, neighbor-joining method, bootstrap value: 1000; the lower scale shows the length of a horizontal line. On behalf of the number of base substitution, “▲”stands for the annotation errors or classification differences sequences. GP1: Group 1; GP2: Group 2; GP3: Group 3; GP4: Group 4.
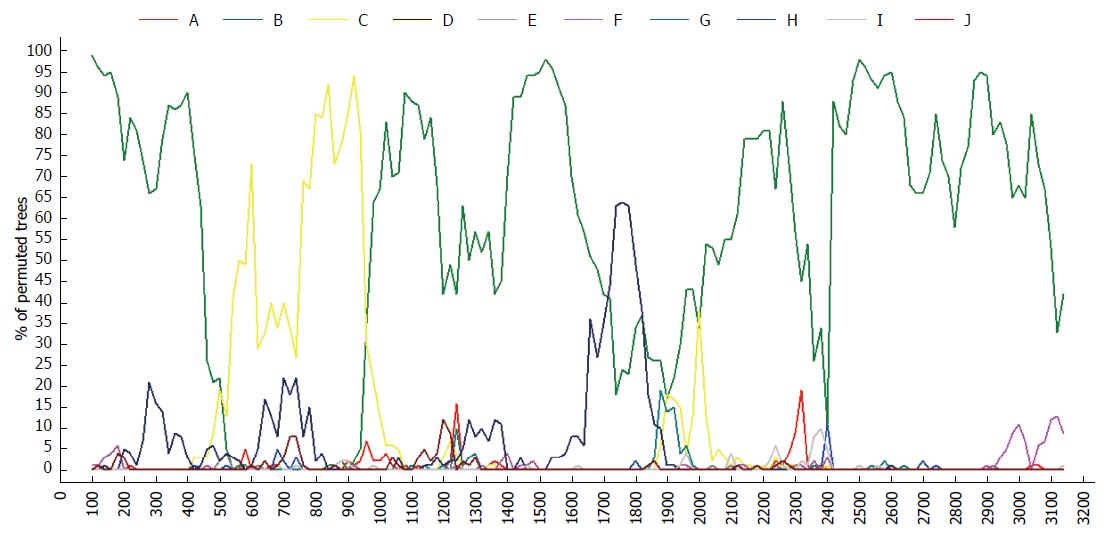
Figure 3 Recombination analysis of FJ386674 by Simplot software.
The reference sequence: AB073857-B, AB073830-B, AB073823-B, AB074755-C, AB033553-C, AB113879-C, AY090457-H, AB179747-H, AY090460-H.
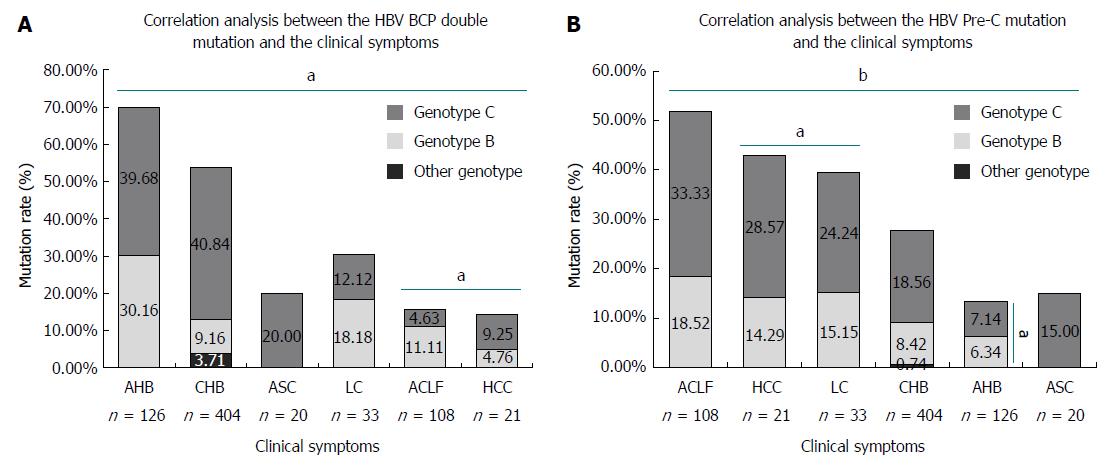
Figure 4 Correlation analysis between mutation and the clinical symptoms.
aP < 0.05, bP < 0.01. HBV: Hepatitis B virus; CHB: Chronic hepatitis B; LC: Liver cirrhosis; ACLF: Acute-on-chronic liver failure; HCC: Hepatocellular carcinoma.
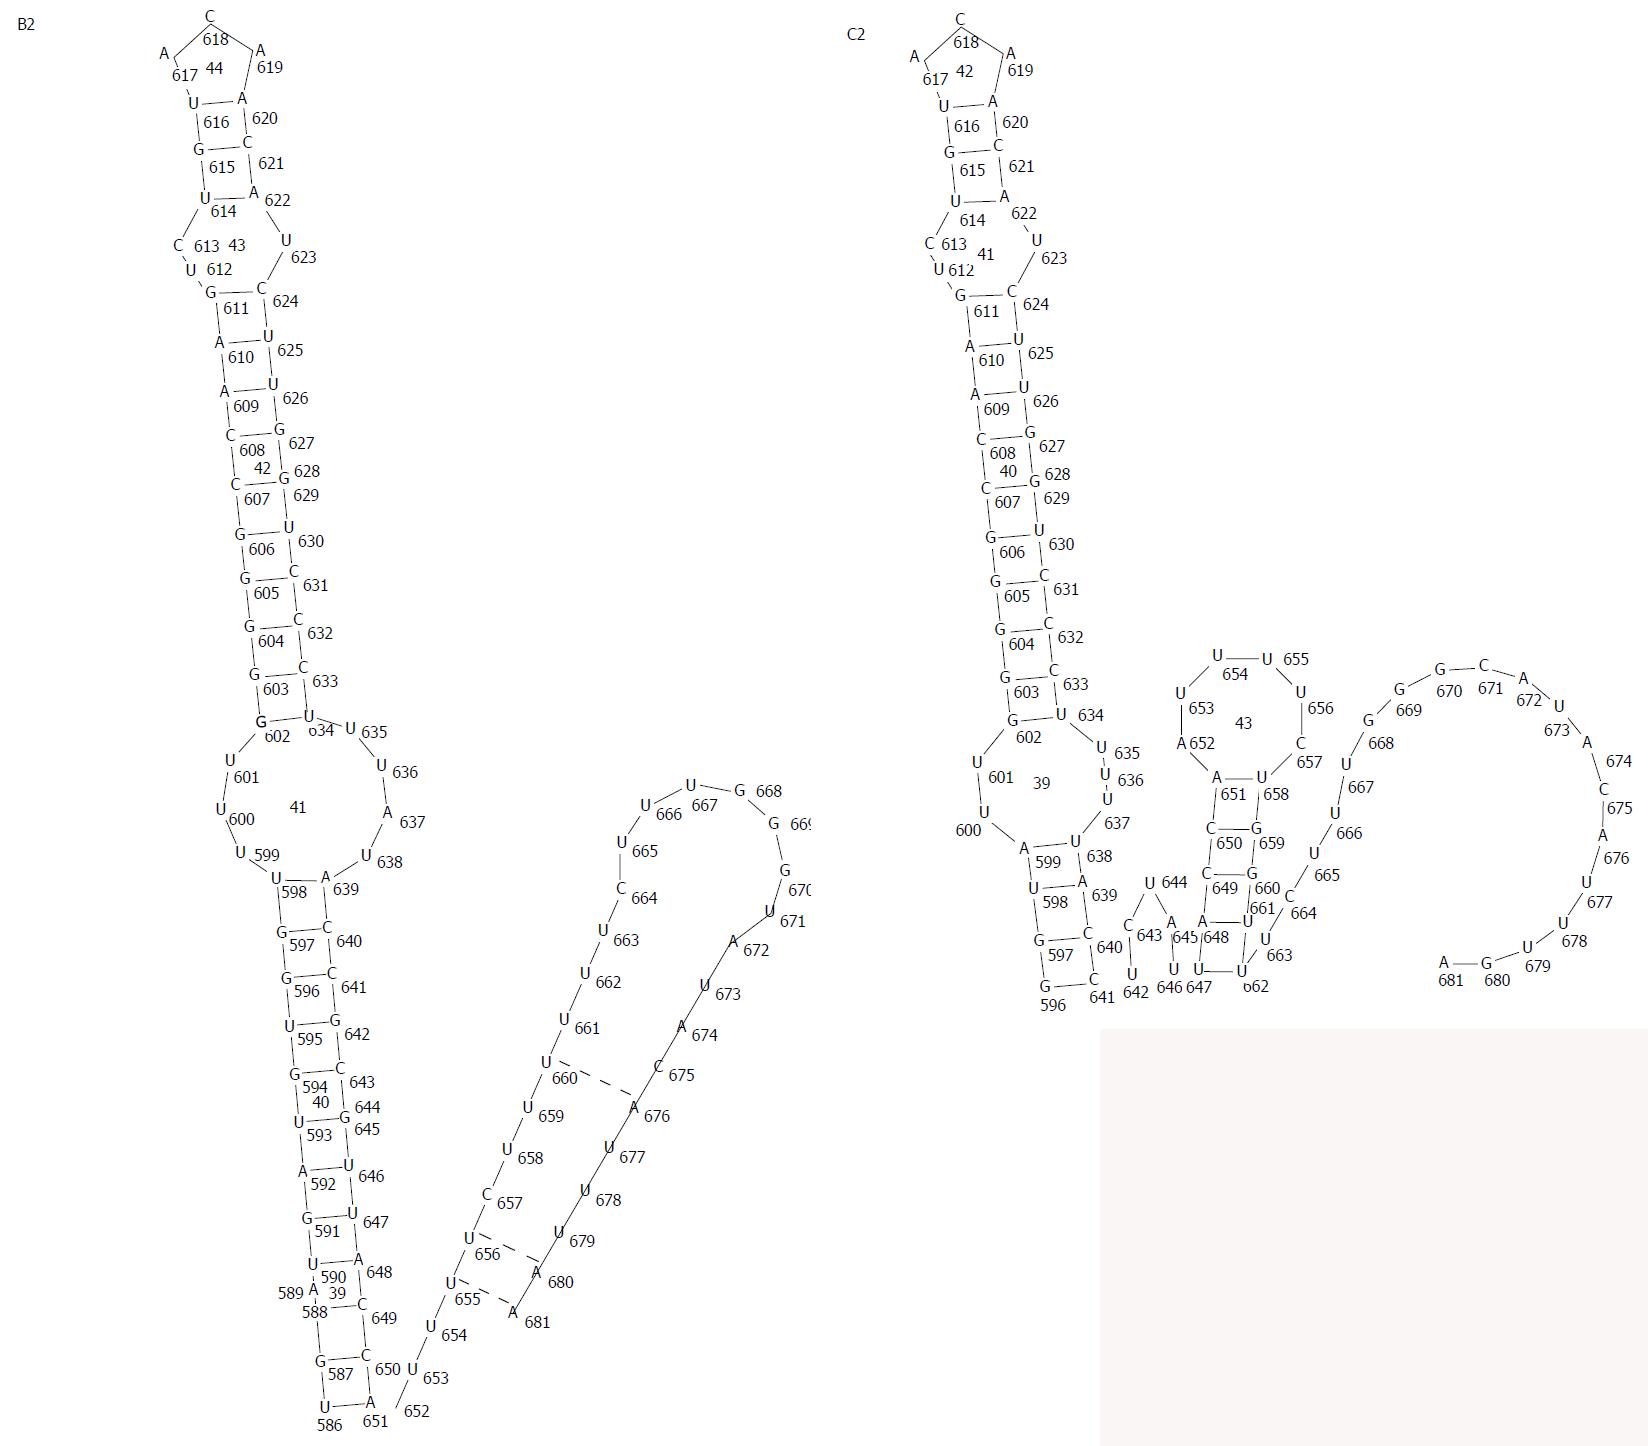
Figure 5 The secondary structure of HBsAg protein RNA expressing TAA and TGA termination codon from subtype B2 (EU939663) and C2 (FJ032351), respectively.
The intermittent line represents base pairs.
- Citation: Li HM, Wang JQ, Wang R, Zhao Q, Li L, Zhang JP, Shen T. Hepatitis B virus genotypes and genome characteristics in China. World J Gastroenterol 2015; 21(21): 6684-6697
- URL: https://www.wjgnet.com/1007-9327/full/v21/i21/6684.htm
- DOI: https://dx.doi.org/10.3748/wjg.v21.i21.6684


