Copyright
©The Author(s) 2015.
World J Gastroenterol. Jun 7, 2015; 21(21): 6675-6683
Published online Jun 7, 2015. doi: 10.3748/wjg.v21.i21.6675
Published online Jun 7, 2015. doi: 10.3748/wjg.v21.i21.6675
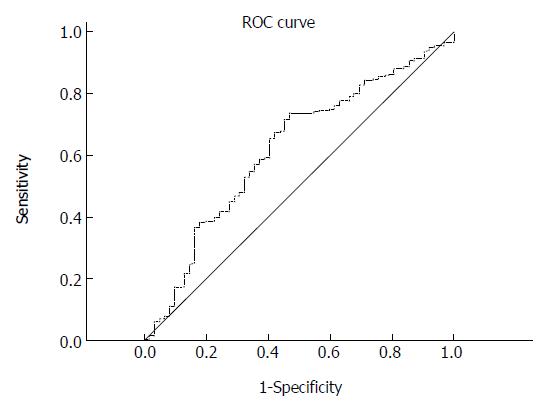
Figure 1 Diagnostic performance of the platelet to lymphocyte ratio in detecting death due to gallbladder carcinoma.
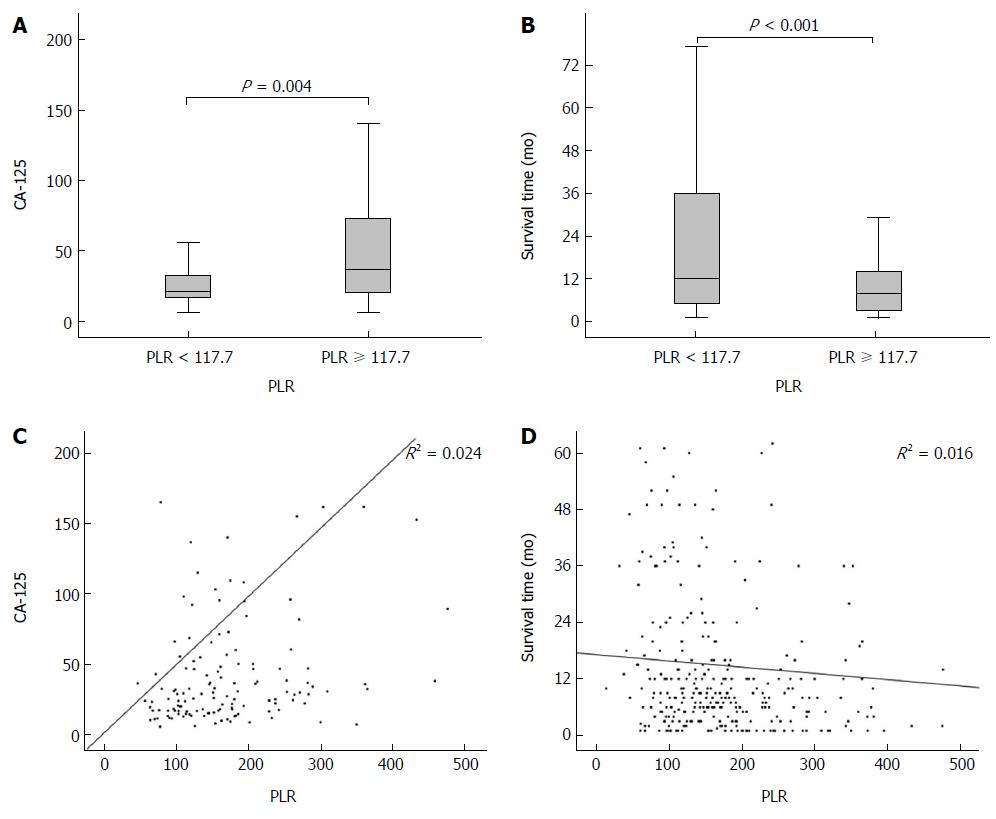
Figure 2 Box plots comparing platelet to lymphocyte ratio with CA125 (A) and survival time (B) and correlation analyses between PLR and CA125 (C) and survival time (D).
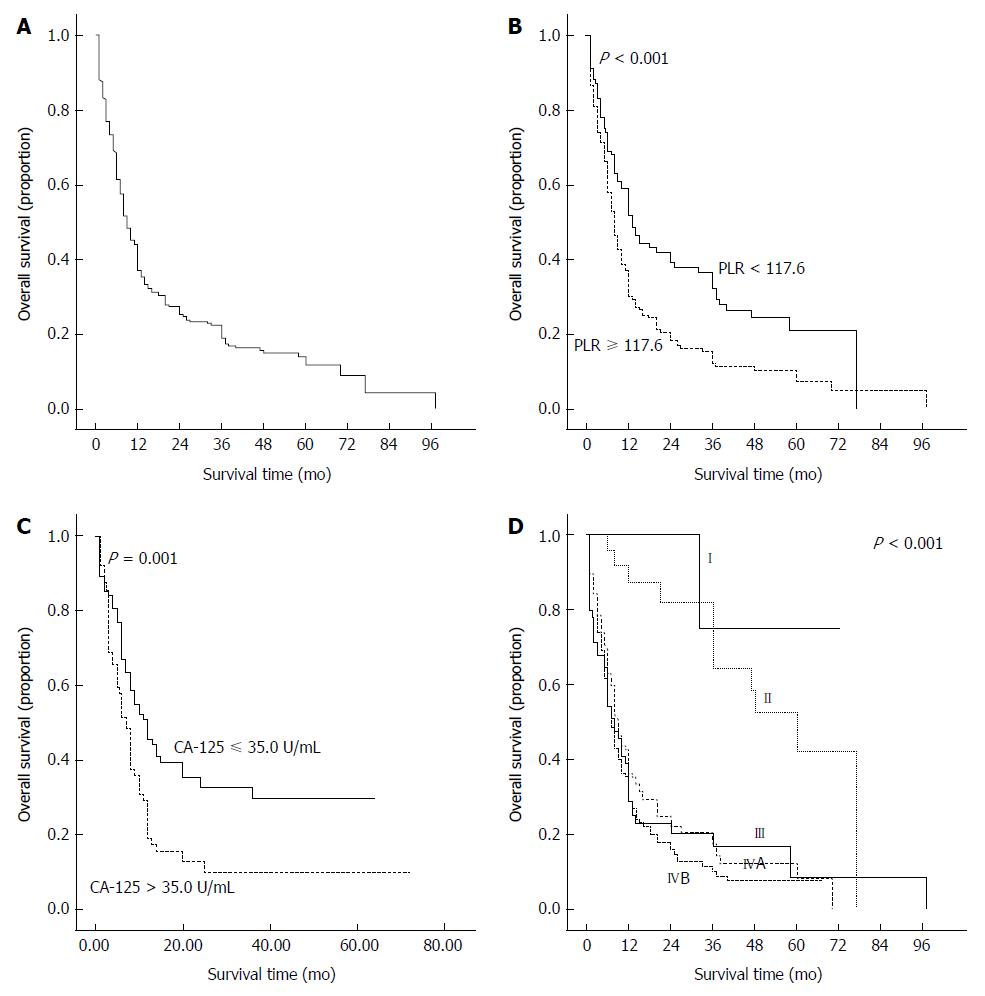
Figure 3 Kaplan-Meier curves for cumulative overall survival of the study population (A) and overall survival of patients stratified according to platelet to lymphocyte ratio (B), CA125 (C), and tumor-node-metastasis stage (D).
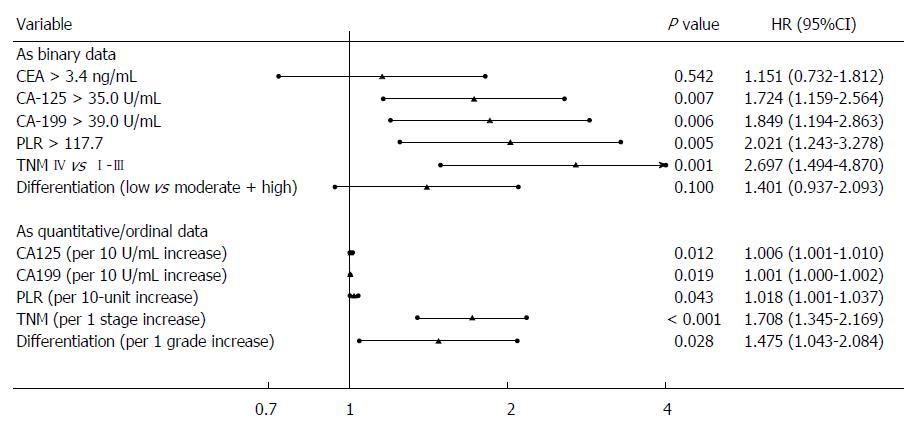
Figure 4 Forest plot based on results of multivariate analysis of factors associated with overall survival of gallbladder carcinoma patients.
TNM: Tumor-node-metastasis.
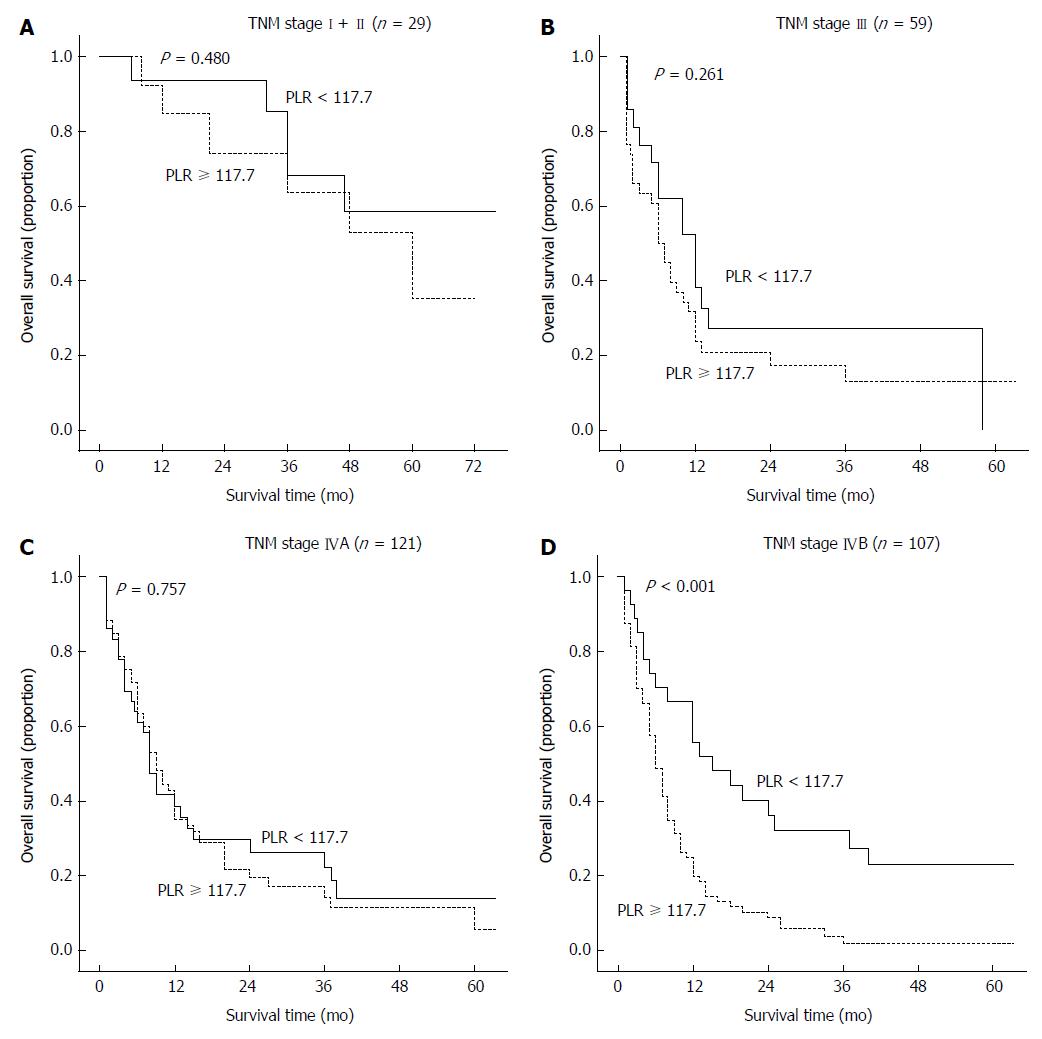
Figure 5 Cumulative survival curves for gallbladder carcinoma patients with TNM stages I-II (A), III (B), IVA (C), and IVB (D), stratified according to PLR.
- Citation: Pang Q, Zhang LQ, Wang RT, Bi JB, Zhang JY, Qu K, Liu SS, Song SD, Xu XS, Wang ZX, Liu C. Platelet to lymphocyte ratio as a novel prognostic tool for gallbladder carcinoma. World J Gastroenterol 2015; 21(21): 6675-6683
- URL: https://www.wjgnet.com/1007-9327/full/v21/i21/6675.htm
- DOI: https://dx.doi.org/10.3748/wjg.v21.i21.6675


