Copyright
©The Author(s) 2015.
World J Gastroenterol. Jun 7, 2015; 21(21): 6665-6674
Published online Jun 7, 2015. doi: 10.3748/wjg.v21.i21.6665
Published online Jun 7, 2015. doi: 10.3748/wjg.v21.i21.6665
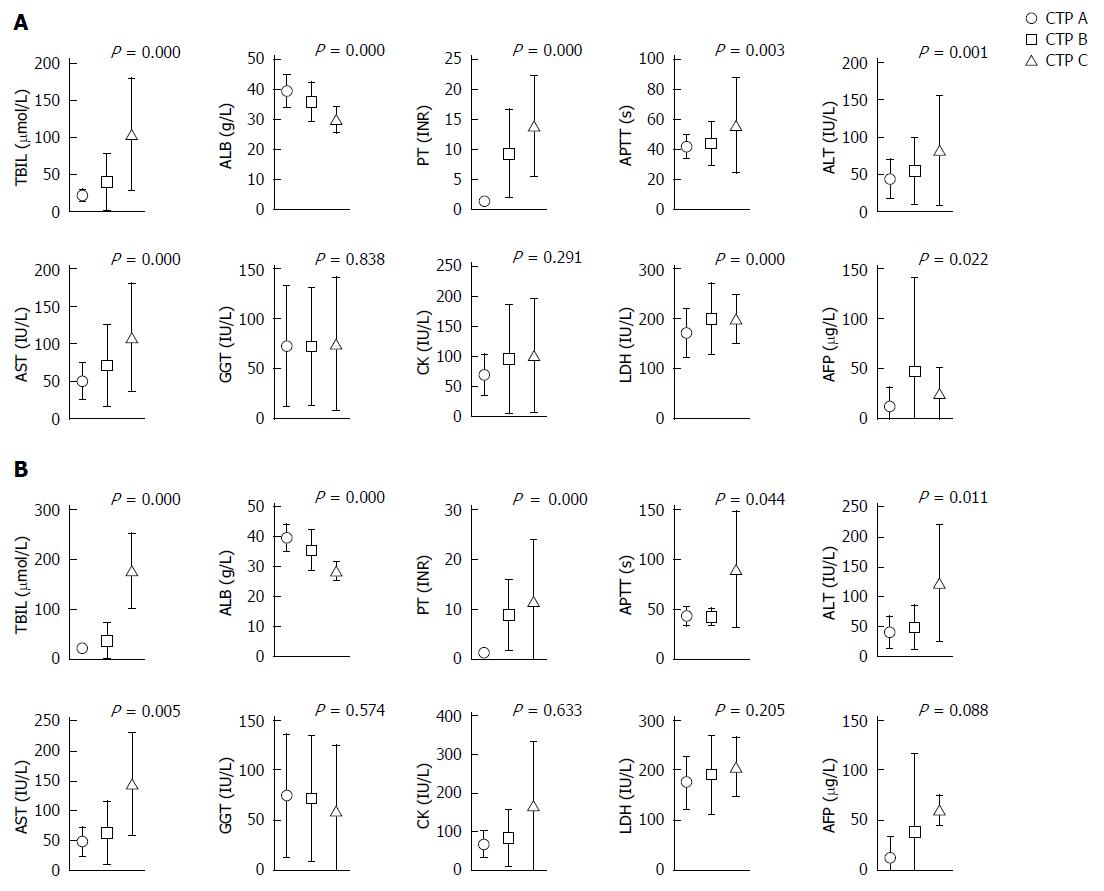
Figure 1 Serum values of the liver parameters of the 611 patients (A) and 152 follow-up patients (B) for different Child-Turcotte-Pugh grades.
CTP: Child-Turcotte-Pugh.
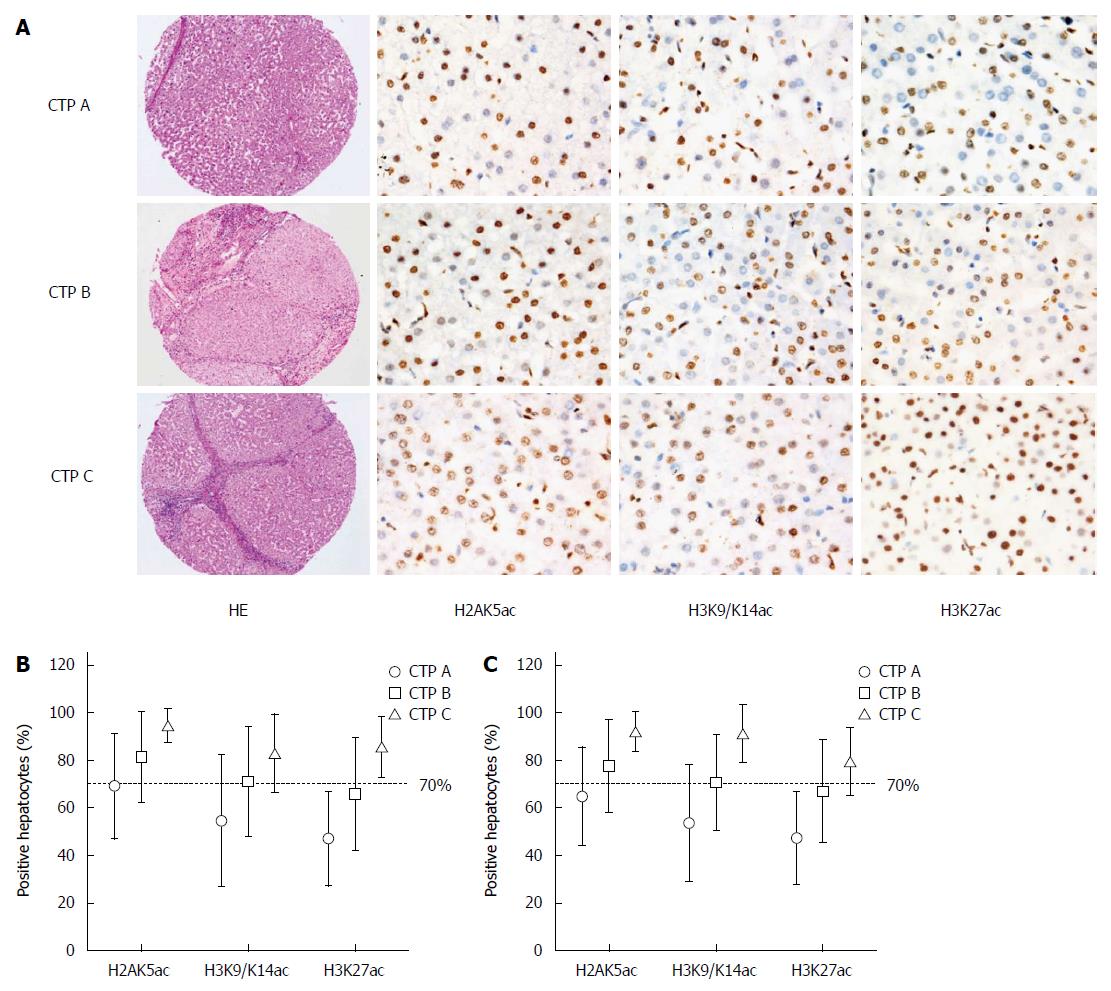
Figure 2 Representative images of hematoxylin and eosin staining (magnification × 20) and immunohistochemistry (magnification × 200) staining of H2AK5ac, H3K9/K14ac and H3K27ac in different Child-Turcotte-Pugh grade tissue microarray slides.
Nuclear brown staining is considered positive expression. From Child-Turcotte-Pugh (CTP) grades A to C, the proportions of hepatocytes that express each marker gradually increase (A). The proportions of H2AK5ac+, K3K9/K14ac+ and H3K27ac+ hepatocytes are statistically significant in different CTP grades for the 611 patients (B) (P < 0.001) and 152 follow-up patients (C) (P < 0.001). The cutoff of 70% acetyl-histone-positive hepatocytes divided the patients into two groups with lower or higher CTP grades. HE: Hematoxylin and eosin.
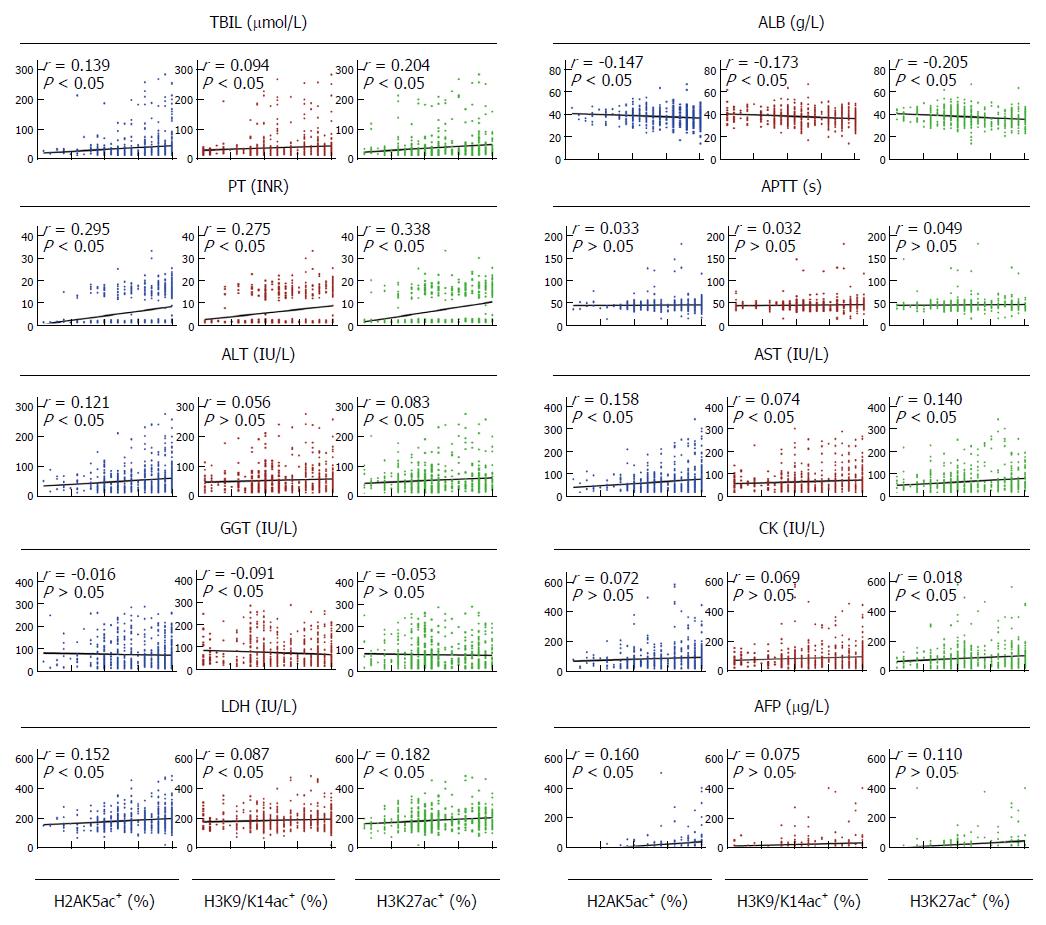
Figure 3 Spearman’s correlation analysis for the serum values of the liver parameters in relation to the positive proportions of H2AK5ac, H3K9/K14ac and H3K27ac in the cirrhotic patients.
X-axis: the acetyl-histone-positive proportions of hepatocytes; Y-axis: the levels of the serum parameters. TBIL: Total bilirubin; ALB: Albumin; PT: Prothrombin time; APTT: Activated partial thromboplastin time; ALT: Alanine aminotransferase; AST: Aspartate aminotransferase; GGT: γ-glutamyl transpeptidase; CK: Creatine kinase; LDH: Lactic dehydrogenase; AFP: Alpha fetoprotein.
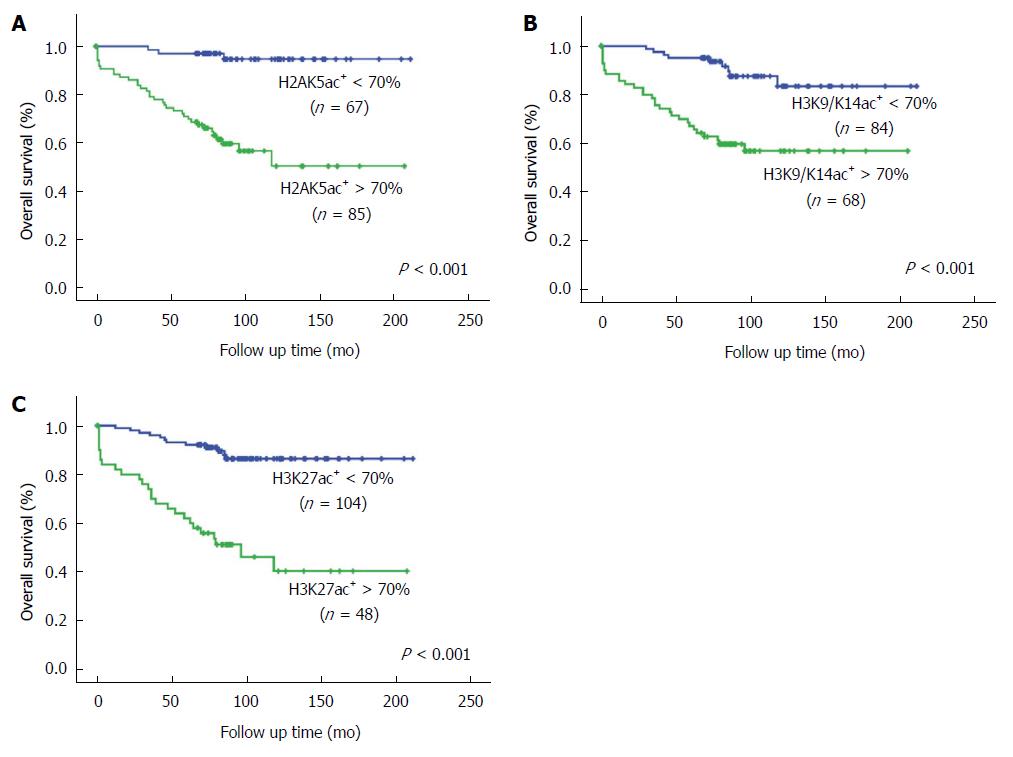
Figure 4 Kaplan-Meier survival curves for the 152 follow-up cirrhotic patients in relation to the positive expression of H2AK5ac (A), H3K9/K14ac (B) and H3K27ac (C).
The patients were divided into two groups according to a cutoff of 70% acetyl-histone-positive hepatocytes. P values were determined by the log-rank test.
- Citation: Zhou P, Xia J, Zhou YJ, Wan J, Li L, Bao J, Shi YJ, Bu H. Proportions of acetyl-histone-positive hepatocytes indicate the functional status and prognosis of cirrhotic patients. World J Gastroenterol 2015; 21(21): 6665-6674
- URL: https://www.wjgnet.com/1007-9327/full/v21/i21/6665.htm
- DOI: https://dx.doi.org/10.3748/wjg.v21.i21.6665


