Copyright
©The Author(s) 2015.
World J Gastroenterol. Jun 7, 2015; 21(21): 6649-6659
Published online Jun 7, 2015. doi: 10.3748/wjg.v21.i21.6649
Published online Jun 7, 2015. doi: 10.3748/wjg.v21.i21.6649
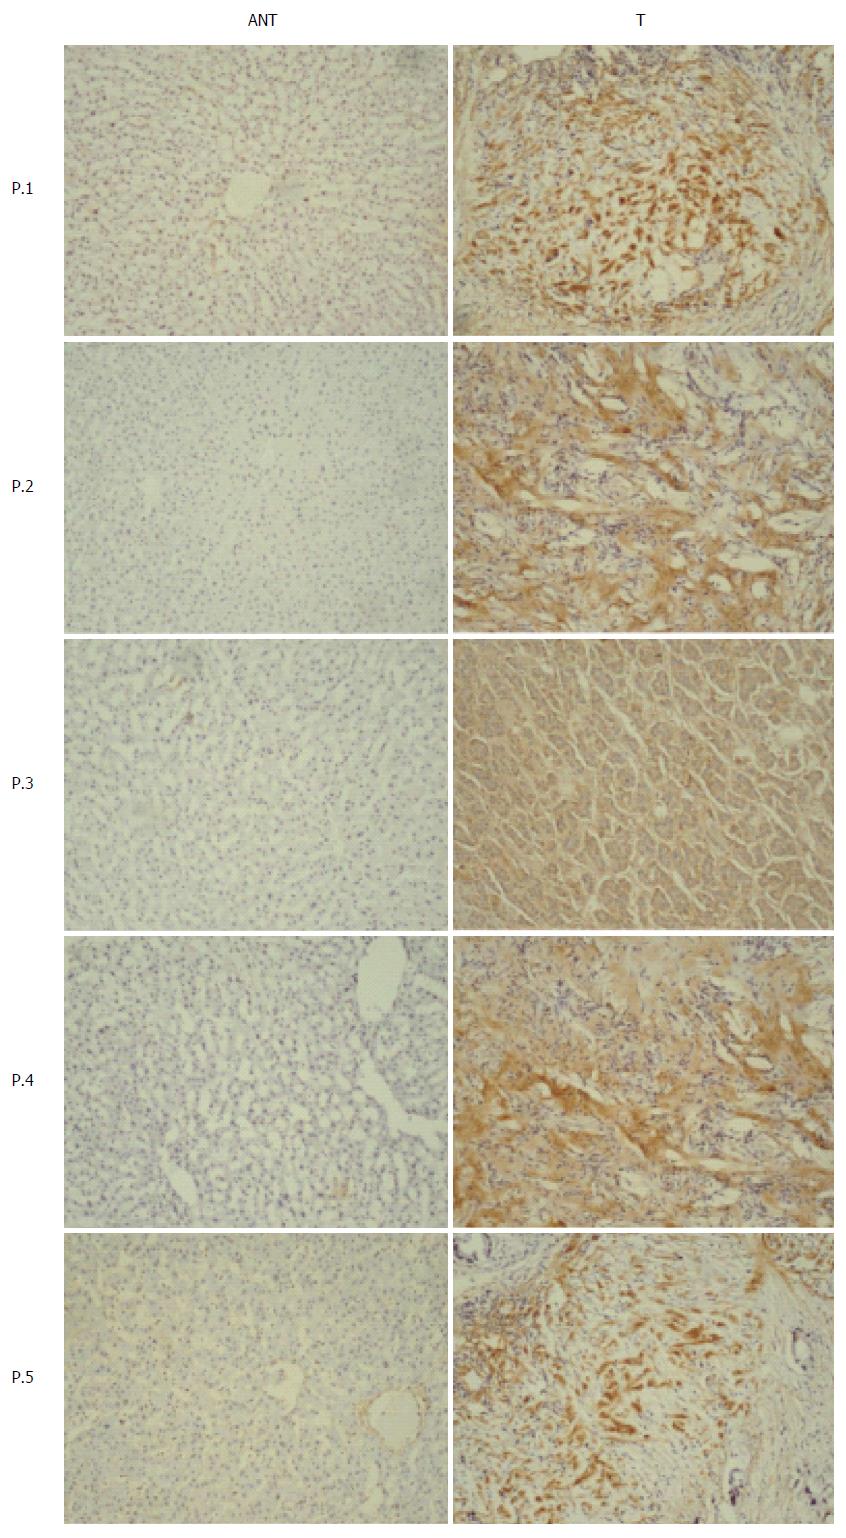
Figure 1 Neuron-glial antigen 2 protein expression in human hepatic carcinoma and matched adjacent non-tumorous tissues.
Neuron-glial antigen 2 expression was examined immunohistochemically in 5 representative pairs of hepatic carcinoma tissue (T) and adjacent non-tumorous tissue (ANT) (magnification × 100).
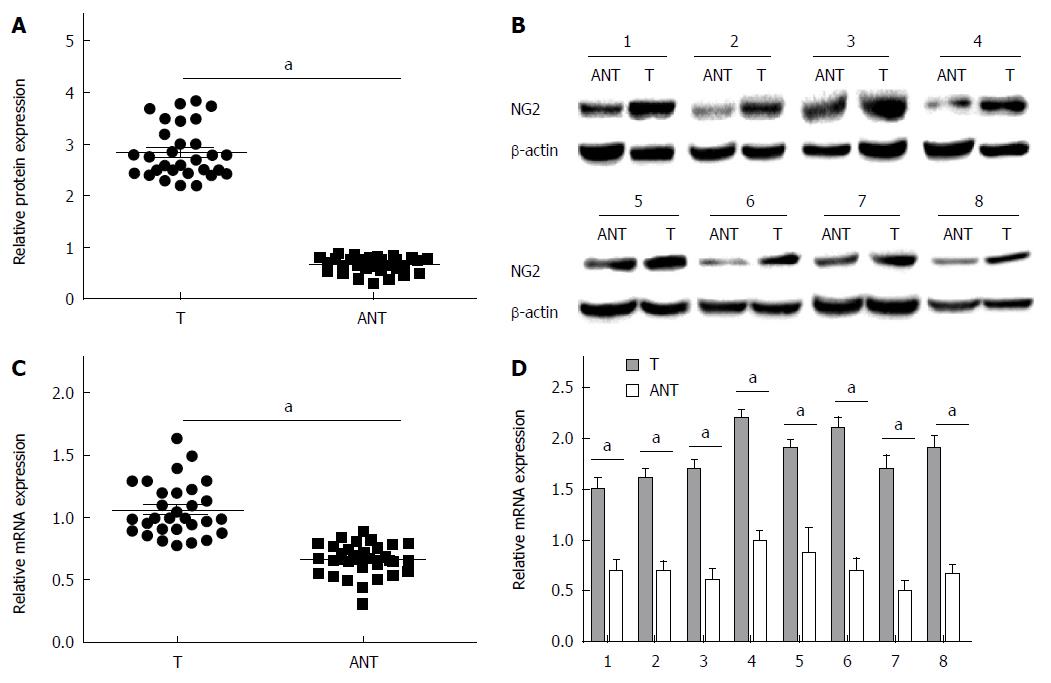
Figure 2 Neuron-glial antigen 2 protein and mRNA expression in human hepatic carcinoma and matched adjacent non-tumorous tissues.
A: The relative neuron-glial antigen 2 (NG2) protein expression levels were measured by Western blot. NG2 expression significantly increased in hepatic carcinoma tissue (T) compared with matched adjacent non-tumorous tissue (ANT) (n = 30). The horizontal lines represent the mean NG2 protein expression level, and the P value is from the paired samples t-test; B: Representative Western blot images of NG2 protein expression in 8 sets of human hepatic carcinoma (T) and matched ANT tissues. β-actin expression was used as a loading control; C: The relative NG2 mRNA expression levels significantly increased in hepatic carcinoma tissue (T) compared with matched ANT (n = 30). The mRNA expression levels were measured by RT-PCR. The horizontal lines represent the mean NG2 mRNA expression levels, and the P value is from the paired samples t-test; D: NG2 mRNA expression levels were compared in 8 pairs of hepatic carcinoma (T) and matched ANT tissues. aP < 0.05.
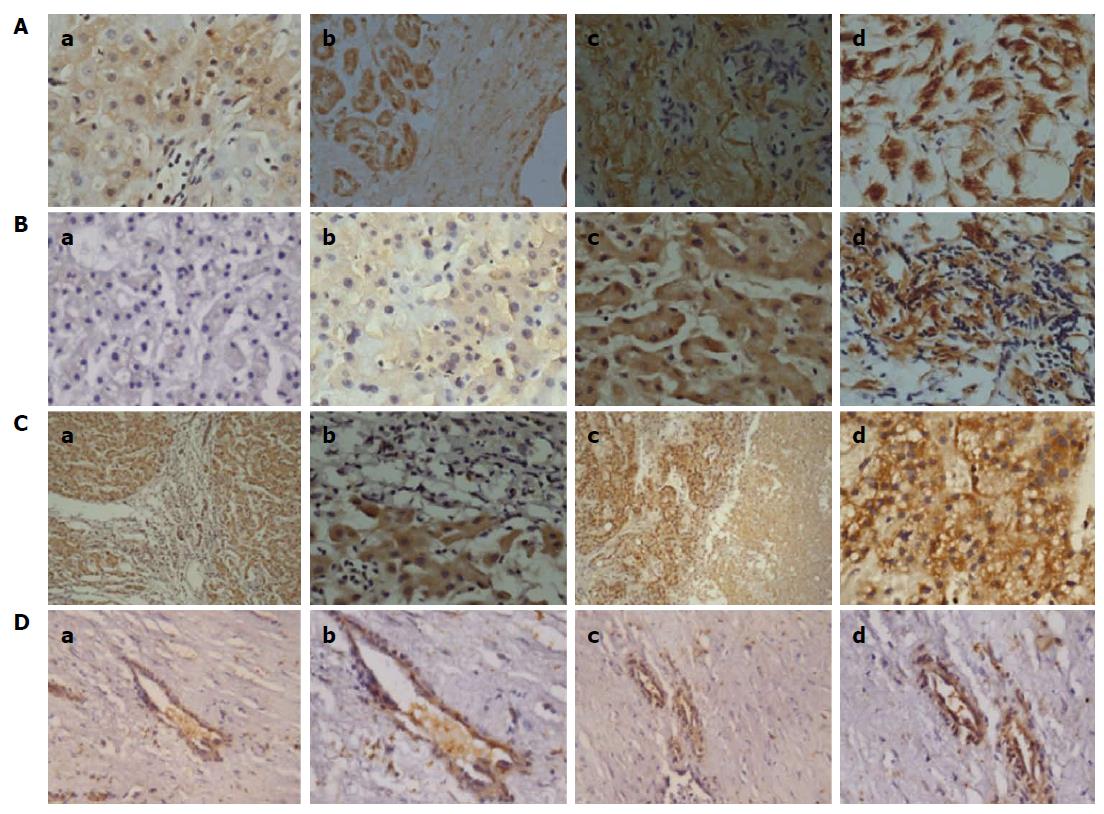
Figure 3 Correlation between neuron-glial antigen 2 expression and clinicopathological features.
A: Neuron-glial antigen 2 (NG2) expression in human hepatic carcinoma tissues at different clinical stages (a: TNM stage I; b: TNM stageII; c: TNM stage III; d: TNM stage IV); B: NG2 protein expression in human hepatic carcinoma tissues with different degrees of differentiation (a: Normally differentiated; b: Well differentiated; c: Moderately differentiated; d: Poorly differentiated); C: NG2 expression in human hepatic carcinoma tissues with portal vein invasion [a, c: Vascular invasion (magnification × 100); b, d: Vascular invasion (magnification × 400)]; D: NG2 expression in vessels within human hepatic carcinoma tissue [a, c: Tumor vessel (magnification × 200); b, d: Tumor vessel (magnification × 400)].
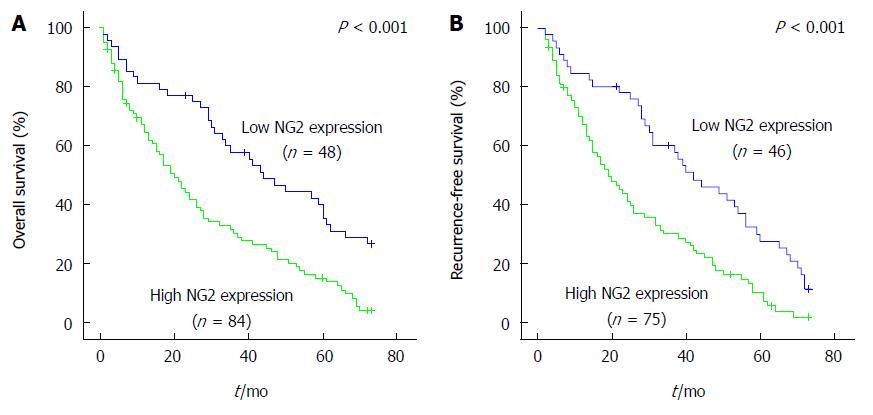
Figure 4 Kaplan-Meier curves of overall survival (A) and disease-free survival (B) based on neuron-glial antigen 2 expression in hepatocellular carcinoma patients.
The P-values were determined using the log-rank test.
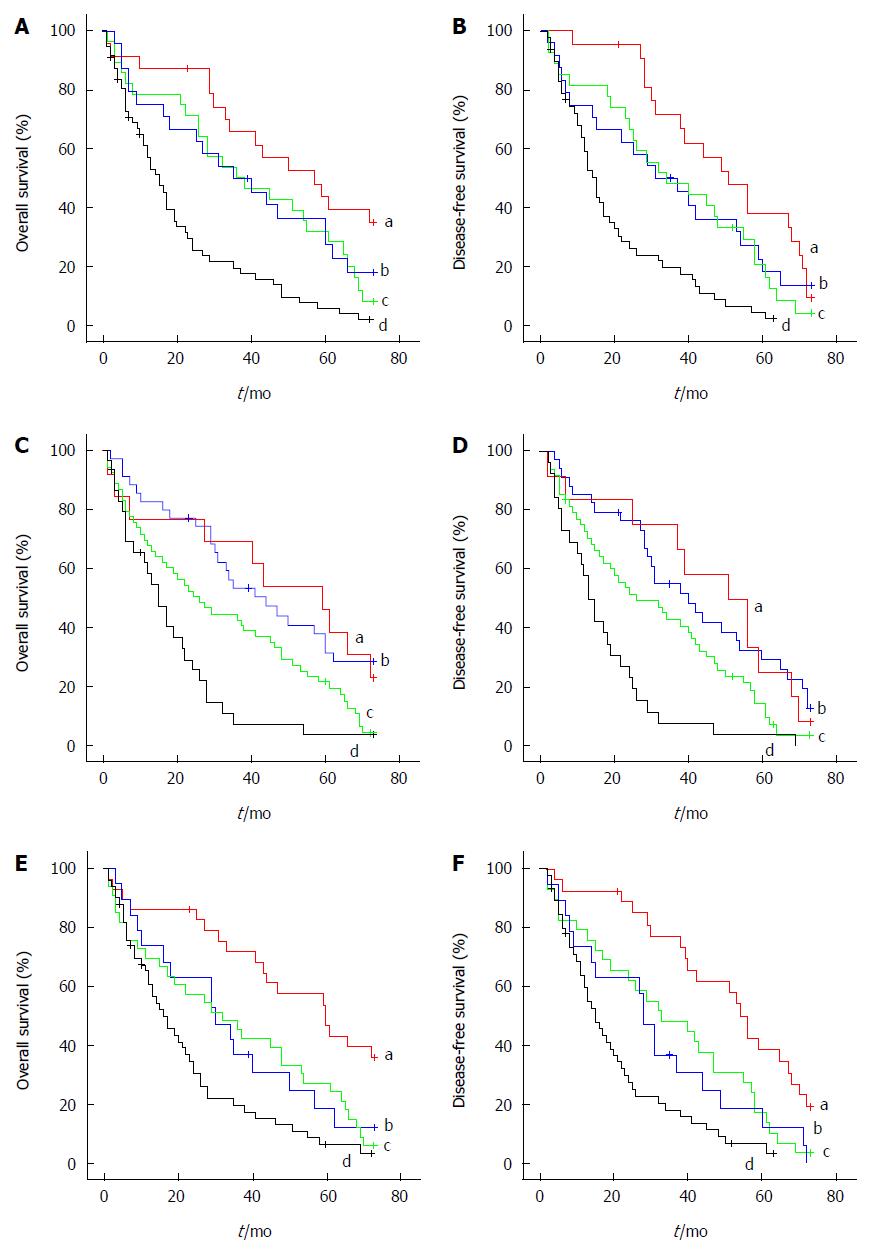
Figure 5 Combination analysis of the survival data.
Overall survival (A) and disease-free survival (B) in hepatocellular carcinoma patients based on NG2 expression and TNM stage. a: TNM stages I/IIwith NG2 low expression; b: TNM stages I/IIwith NG2 high expression; c: TNM stages III/IV with NG2 low expression; d: TNM stages III/IV with NG2 high expression; Overall survival (C) and disease-free survival (D) in hepatocellular carcinoma patients based on NG2 expression and serum AFP. a: Low level of serum AFP with NG2 low expression; b: Low level of serum AFP with NG2 high expression; c: High level of serum AFP with NG2 low expression; d: High level of serum AFP with NG2 high expression; Overall survival (E) and disease-free survival (F) in hepatocellular carcinoma patients based on NG2 expression and venous invasion. a: No invasion with NG2 low expression; b: No invasion with NG2 high expression; c: Invasion with NG2 low expression; d: No invasion with NG2 high expression.
- Citation: Lu LL, Sun J, Lai JJ, Jiang Y, Bai LH, Zhang LD. Neuron-glial antigen 2 overexpression in hepatocellular carcinoma predicts poor prognosis. World J Gastroenterol 2015; 21(21): 6649-6659
- URL: https://www.wjgnet.com/1007-9327/full/v21/i21/6649.htm
- DOI: https://dx.doi.org/10.3748/wjg.v21.i21.6649


