Copyright
©The Author(s) 2015.
World J Gastroenterol. Jun 7, 2015; 21(21): 6591-6603
Published online Jun 7, 2015. doi: 10.3748/wjg.v21.i21.6591
Published online Jun 7, 2015. doi: 10.3748/wjg.v21.i21.6591
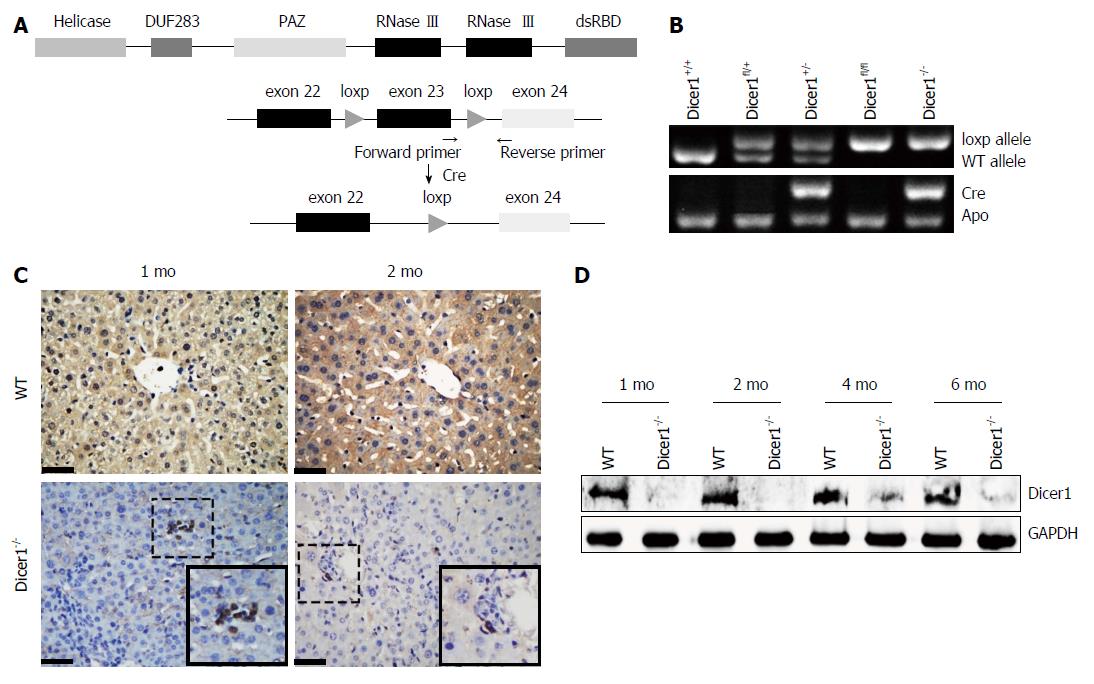
Figure 1 Confirmation of selective Dicer1 knockout in hepatocytes.
A: Diagram of the DNA insertion site of the loxP alleles; B: Electropherogram of tail DNA genotyping (Apo was used as a positive control); C, D: Dicer1 immunohistochemistry staining (Scale bar: 100 μm) and Western blotting were performed respectively to detect Dicer1 expression.
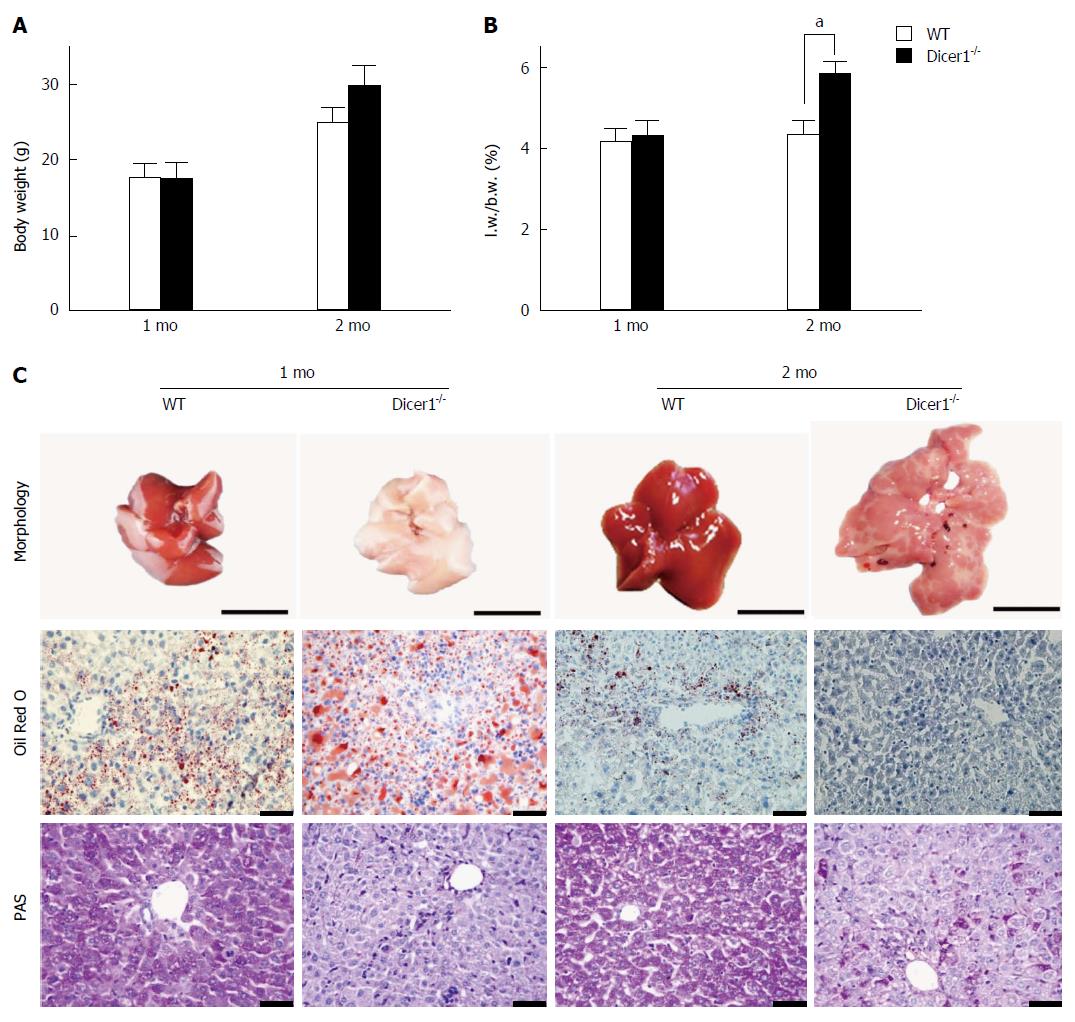
Figure 2 Morphology and metabolism changes of Dicer1-/- liver at indicated age.
A, B: Body weight and the ratio of liver weight/body weight (l.w./b.w.) in wild-type and Dicer1-/- mice (mean ± SD; n = 6), aP < 0.05 vs wild-type mice, l.w. vs b.w.; C: Gross observation of the livers (Scale bar: 1 cm). PAS staining and Oil Red O staining were performed respectively to detect the abnormal changes of Dicer1-deficient livers (Scale bar: 100 μm).
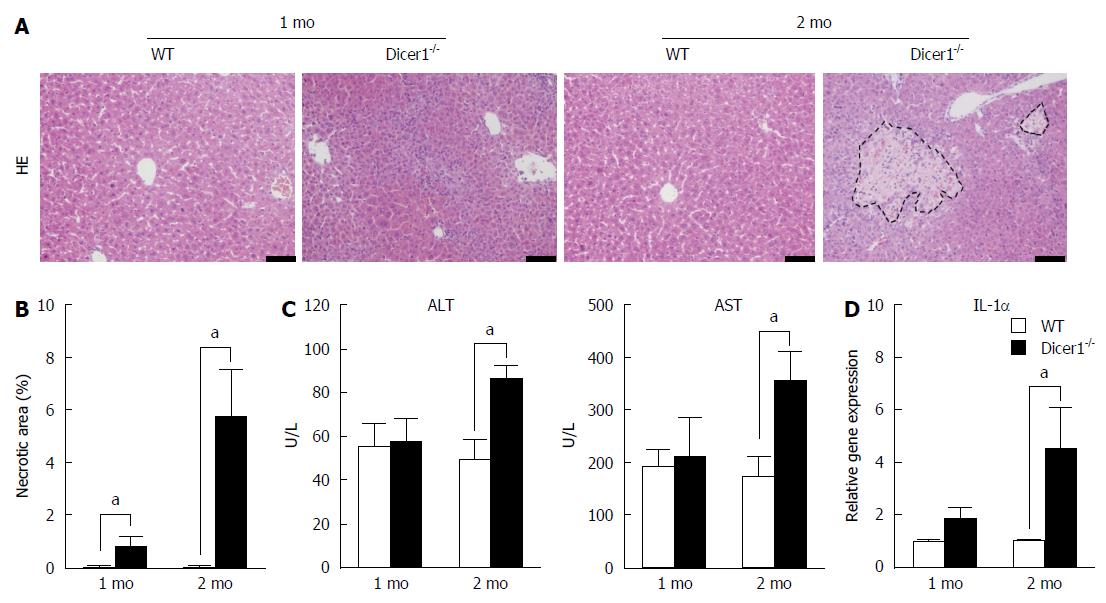
Figure 3 Increased necrotic area in the Dicer1-/- liver.
A: Hematoxylin-eosin stained liver tissue from Dicer1-/- mouse shows necrosis (Scale bar: 200 μm). The necrotic area is circled with black dotted lines; B: Quantitative analysis of necrotic area observed on HE stained sections (mean ± SD; n = 4-5), aP < 0.05 vs wild-type mice; C: ALT and AST serum levels in the wild-type and Dicer1-deficient mice at indicated time points (mean ± SD; n = 4-6), aP < 0.05 vs wild-type mice; D: IL-1α expression in Dicer1-/- liver was compared with control littermates (mean ± SD; n = 4), aP < 0.05 vs wild-type mice. ALT: Alanine amino-transferase; AST: Aspartate amino-transferase.
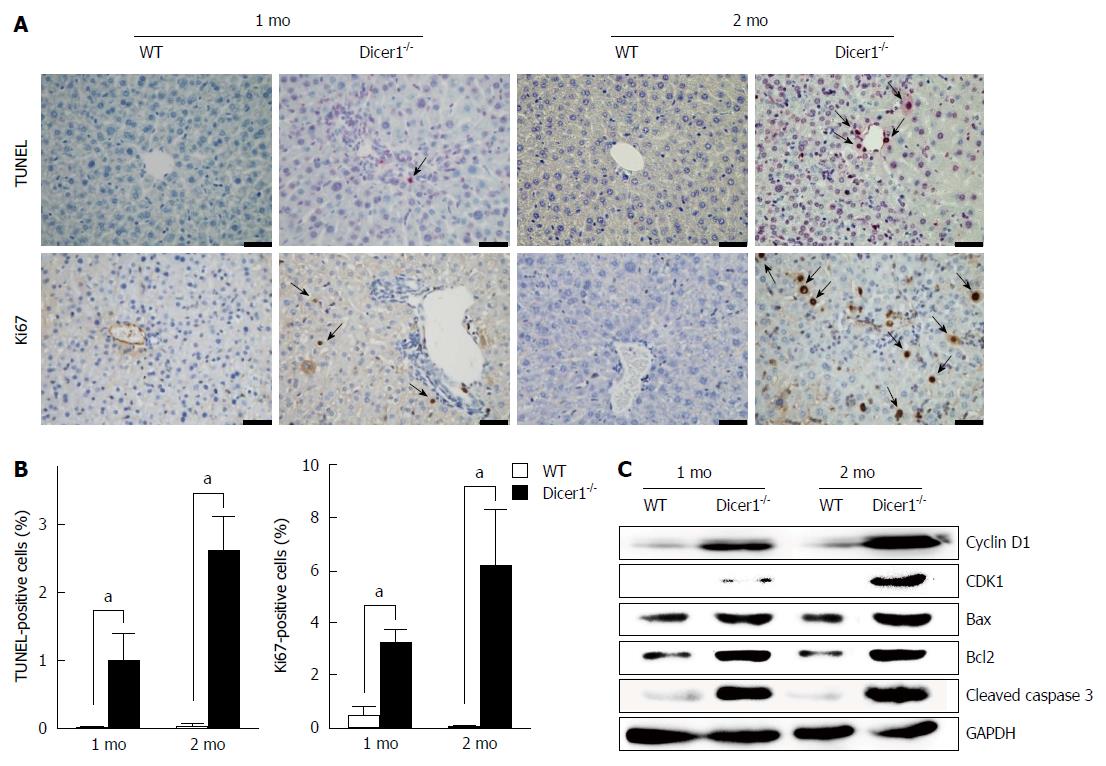
Figure 4 Dicer1-/- liver displays increased hepatocyte death and compensatory proliferation.
A: Significant hepatocyte apoptosis and proliferation in the Dicer1-deficient liver (Scale bar: 100 μm); B: Quantification of hepatocyte apoptosis (TUNEL staining) and proliferation (Ki67 immunohistochemistry) in Dicer1-deficient liver (mean ± SD; n = 4-5), aP < 0.05 vs wild-type mice; C: Western blot analysis of the liver tissue lysates with indicated antibodies. GAPDH was used as an internal control.
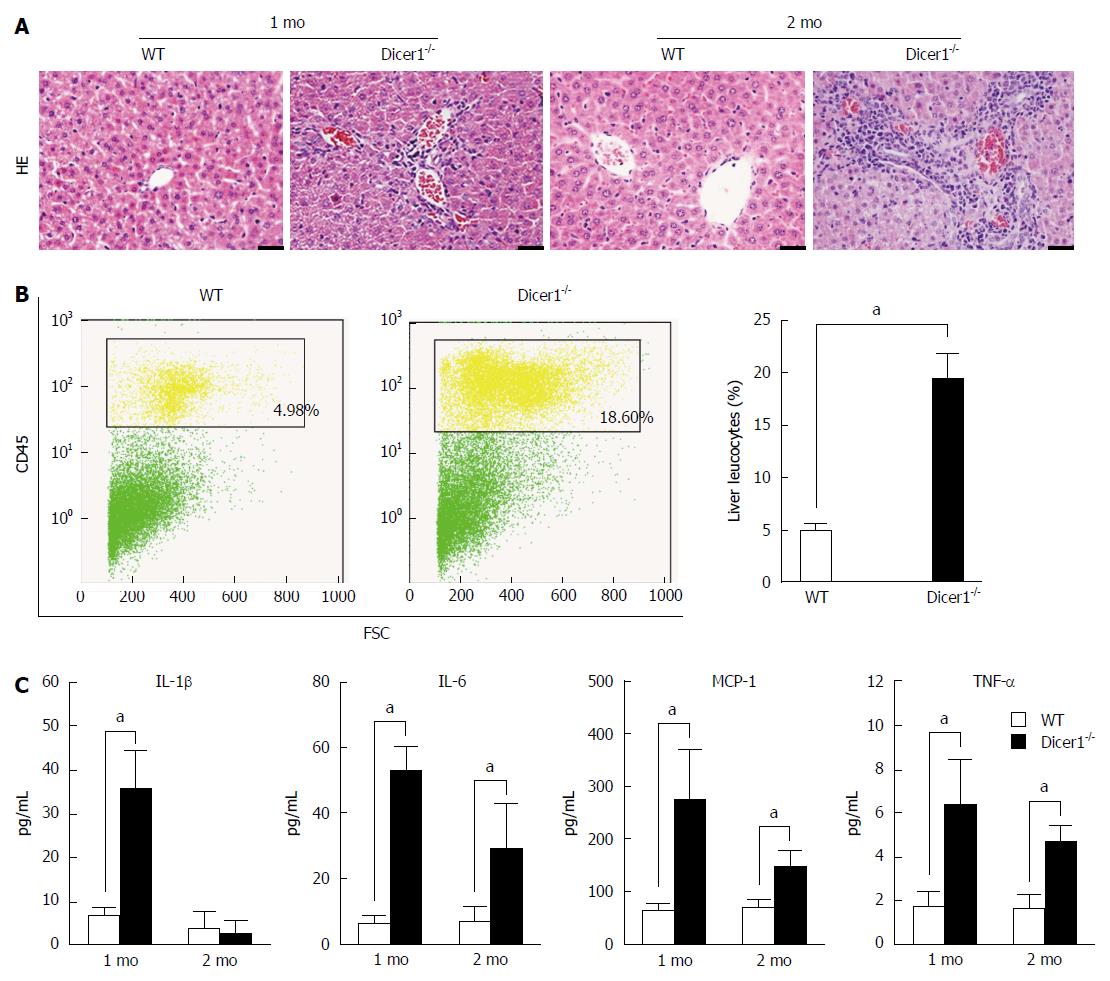
Figure 5 Dicer1-deficient liver develops chronic inflammation.
A: Hematoxylin-eosin staining show remarkable liver inflammation in Dicer1-deficient livers (Scale bar: 100 μm); B: Intrahepatic inflammation cells was determined by flow cytometric analysis for the pan-leucocyte marker CD45 in 2-mo-old mice (mean ± SD; n = 4-6), aP < 0.05 vs wild-type mice; C: Serum cytokine concentrations were determined by Luminex assay, Dicer1-deficient mice expressed significantly higher level of IL-1β, IL-6, MCP-1, and TNF-α (mean ± SD; n = 4-6), aP < 0.05 vs wild-type mice.
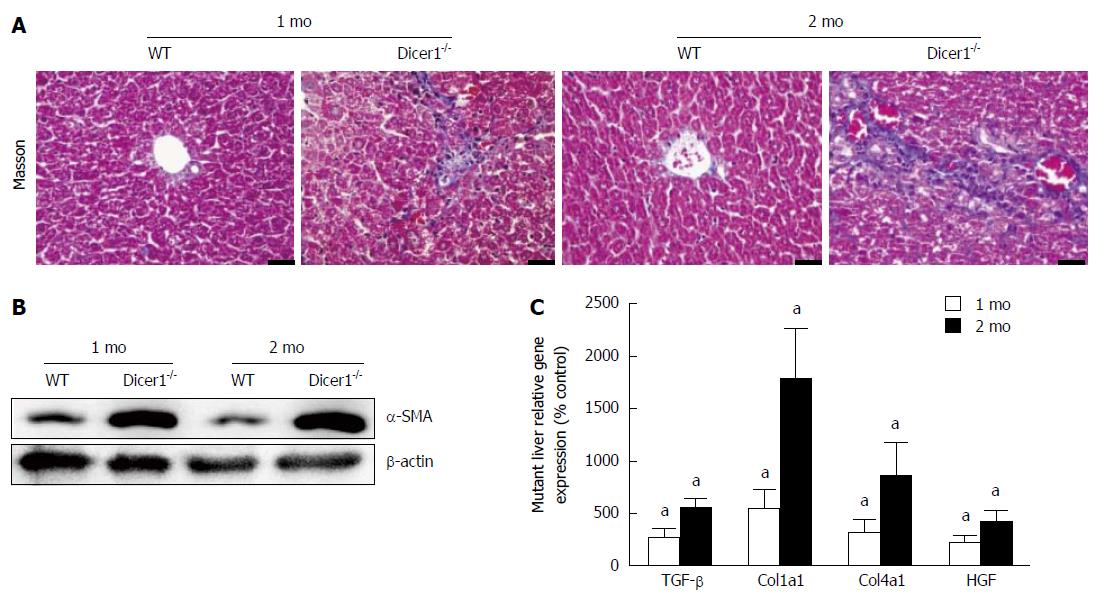
Figure 6 Chronic fibrosis in the Dicer1-deficient liver.
A: Masson staining showed remarkable liver fibrosis in Dicer1-deficient livers (Scale bar: 100 μm); B: Hepatic stellate cells were highly activated in Dicer1-deficient mice liver; C: The relative gene expression of fibrogenic markers, including TGF-β, Col1a1, Col4a1 and HGF, was determined by qPCR (mean ± SD; n = 4-6); aP < 0.05 vs wild-type mice.
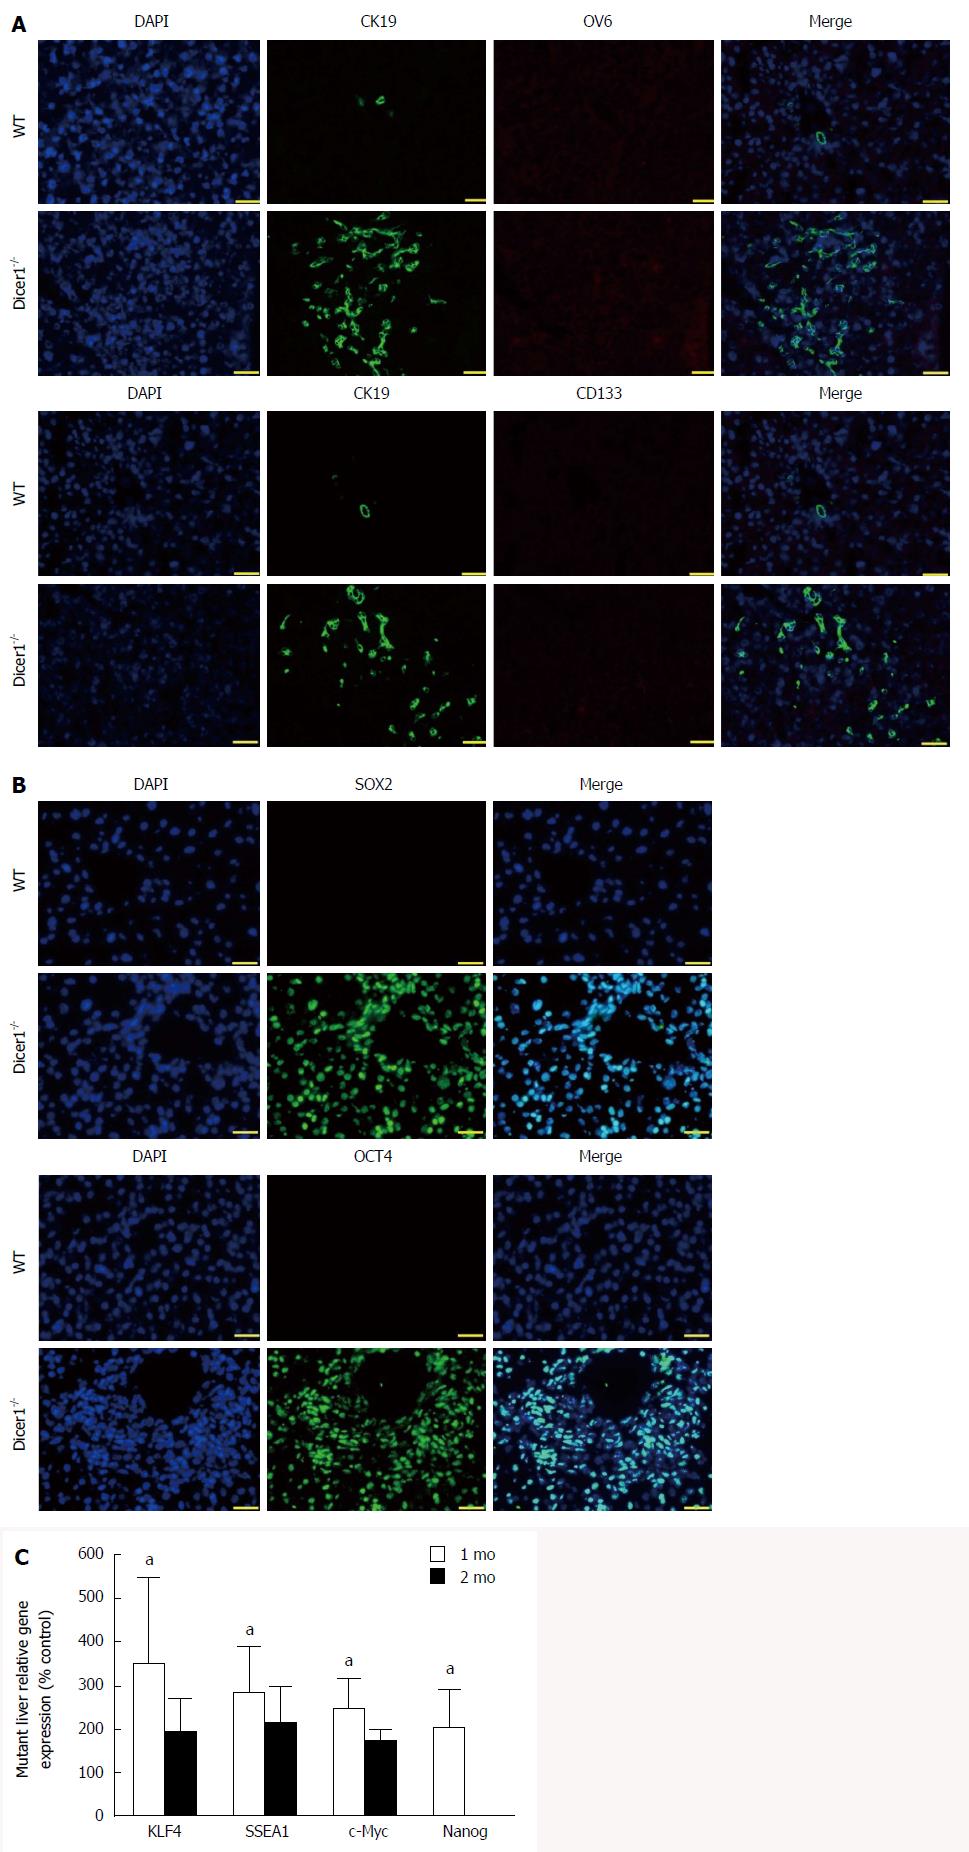
Figure 7 Activation of liver progenitor cells in the mutant liver.
A: Immunofluorescence of CK19, CD133 and OV6 in the 1-mo-old mutant liver section exhibits a robust ductular reaction (Scale bar: 200 μm); B: Immunofluorescence of SOX2 and OCT4 in 1-mo-old Dicer1-/- liver shows a large numbers of SOX2- and OCT4-positive cells both in the portal areas and parenchyma (Scale bar: 100 μm); C: Pluripotency transcription factors gene expression was shown for each gene as percent of expression in Dicer1-/- mice compared with control littermates (mean ± SD; n = 4), aP < 0.05 vs wild-type mice.
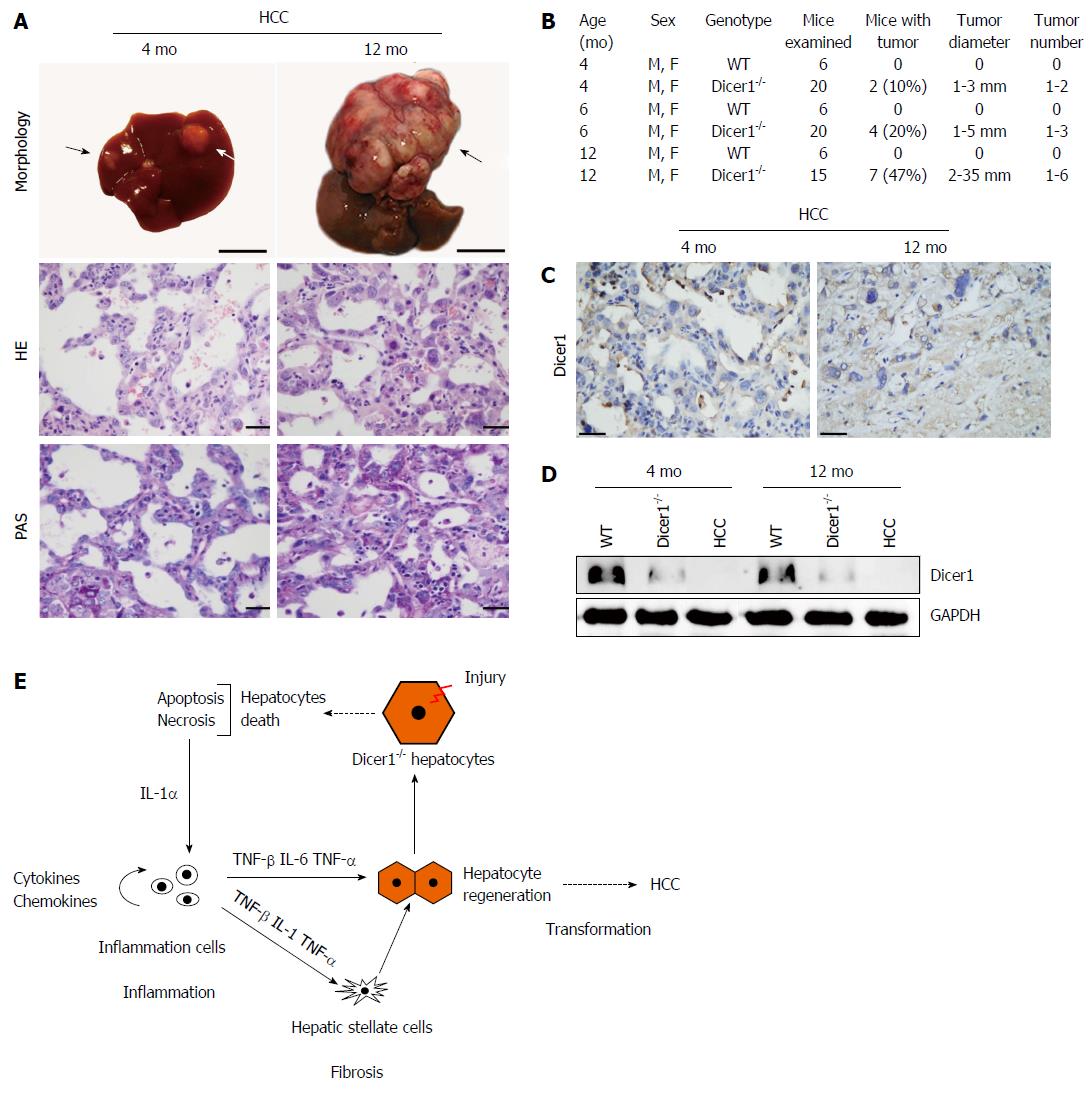
Figure 8 Spontaneous hepatocarcinogenesis in the Dicer1-deficient liver.
A: Hepatocellular carcinomas in Albumin-Cre; Dicer1fl/fl mice at 4 and 12 mo after birth (Scale bar: 1 cm). Hematoxylin-eosin staining and PAS staining of the Dicer1-deficient liver tumors (Scale bar: 100 μm); B: Summary of incidence and characteristics of the tumors that developed in 4- to 12-mo-old mutant mice; C, D: Dicer1 immunohistochemistry (Scale bar: 100 μm) and Western blotting were performed respectively to detect the Dicer1 expression level in HCC; E: The roles of hepatocyte death, inflammation and fibrosis in the histological processes of hepatocarcinogenesis in the Dicer1-deficient liver.
- Citation: Lu XF, Zhou YJ, Zhang L, Ji HJ, Li L, Shi YJ, Bu H. Loss of Dicer1 impairs hepatocyte survival and leads to chronic inflammation and progenitor cell activation. World J Gastroenterol 2015; 21(21): 6591-6603
- URL: https://www.wjgnet.com/1007-9327/full/v21/i21/6591.htm
- DOI: https://dx.doi.org/10.3748/wjg.v21.i21.6591


