Copyright
©The Author(s) 2015.
World J Gastroenterol. Jun 7, 2015; 21(21): 6434-6443
Published online Jun 7, 2015. doi: 10.3748/wjg.v21.i21.6434
Published online Jun 7, 2015. doi: 10.3748/wjg.v21.i21.6434
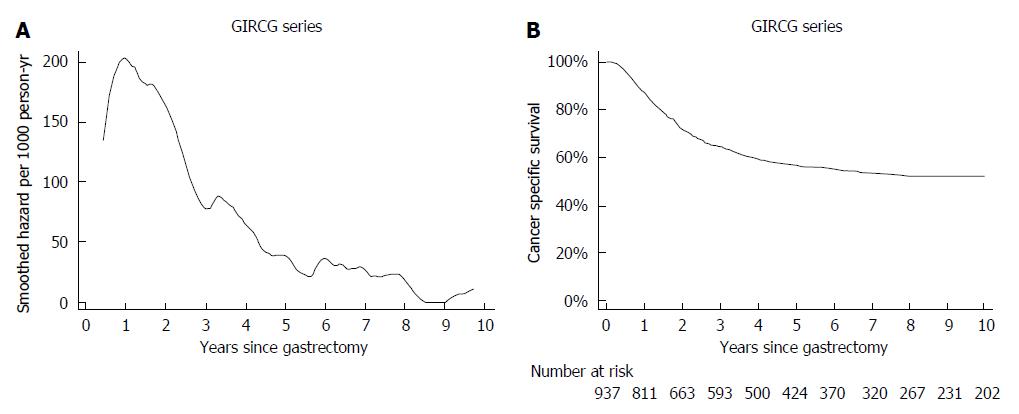
Figure 1 Temporal trend of recurrence-related mortality (A) and corresponding cancer-related survival (B) in a GIRCG series of 937 gastric cancer patients.
To plot the estimated hazard function, a kernel smooth was used with a bandwidth of 2.5 mo. Survival curve was estimated by the Kaplan-Meier method.
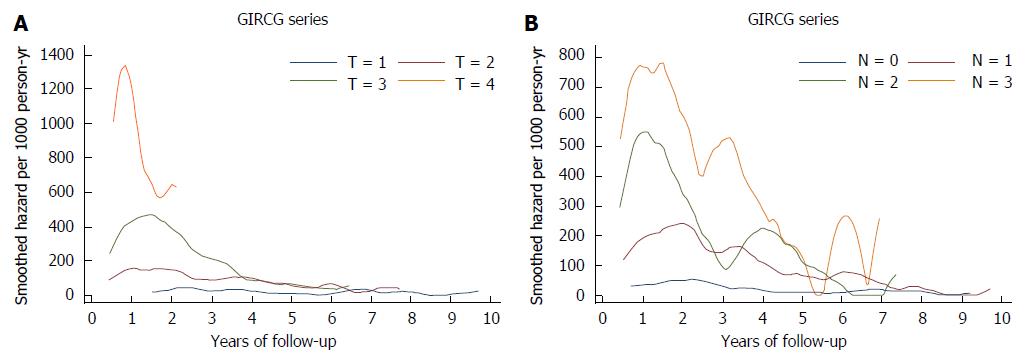
Figure 2 Temporal trend in mortality from recurrence, as a function of T (1997) (A) and N (1997) (B) status in a GIRCG series of 937 patients.
To plot the estimated hazard function, a kernel smooth was used with a bandwidth of 3 mo.
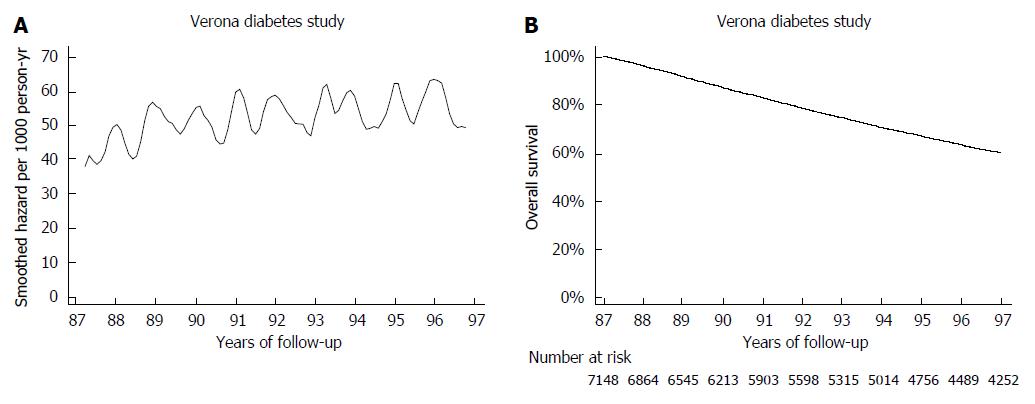
Figure 3 Temporal trend of all-cause mortality (A) and corresponding overall survival (B) in the 7148 type 2 diabetic patients from the Verona Diabetes Study.
To plot the estimated hazard function, a kernel smooth was used with a bandwidth of 1.5 mo. Survival curve was estimated by the Kaplan-Meier method.
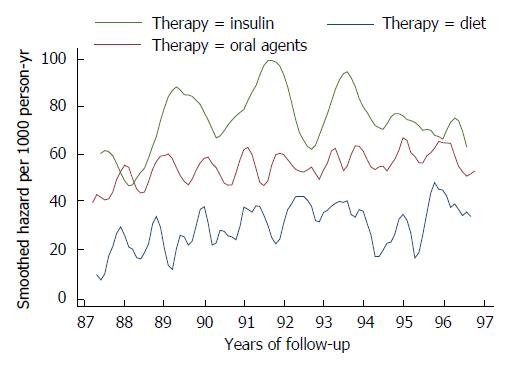
Figure 4 Temporal trend of all-cause mortality in the 7148 type 2 diabetic patients from the Verona Diabetes Study as a function of treatment, a proxy of disease progression.
To plot the estimated hazard function, a kernel smooth was used with a bandwidth of 1.5 mo for the groups treated with diet and oral hypoglycemic drugs, and 4 mo for the group treated with insulin.
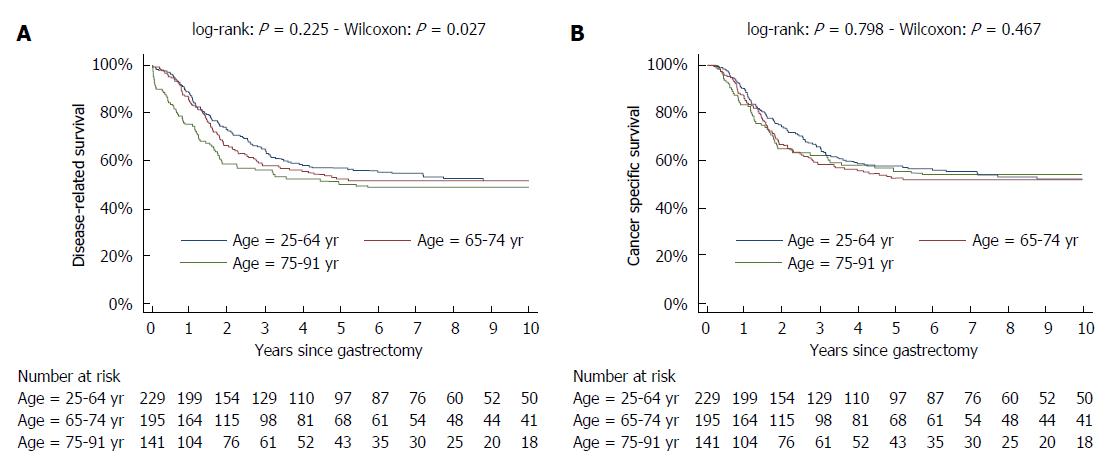
Figure 5 Survival curves as a function of age (25-64, 65-74, 75-91 years), estimated by Kaplan-Meier method as on a GIRCG series of 568 patients undergoing R0 gastrectomy for gastric cancer.
Post-operative mortality is taken into account in (A) but not in (B).
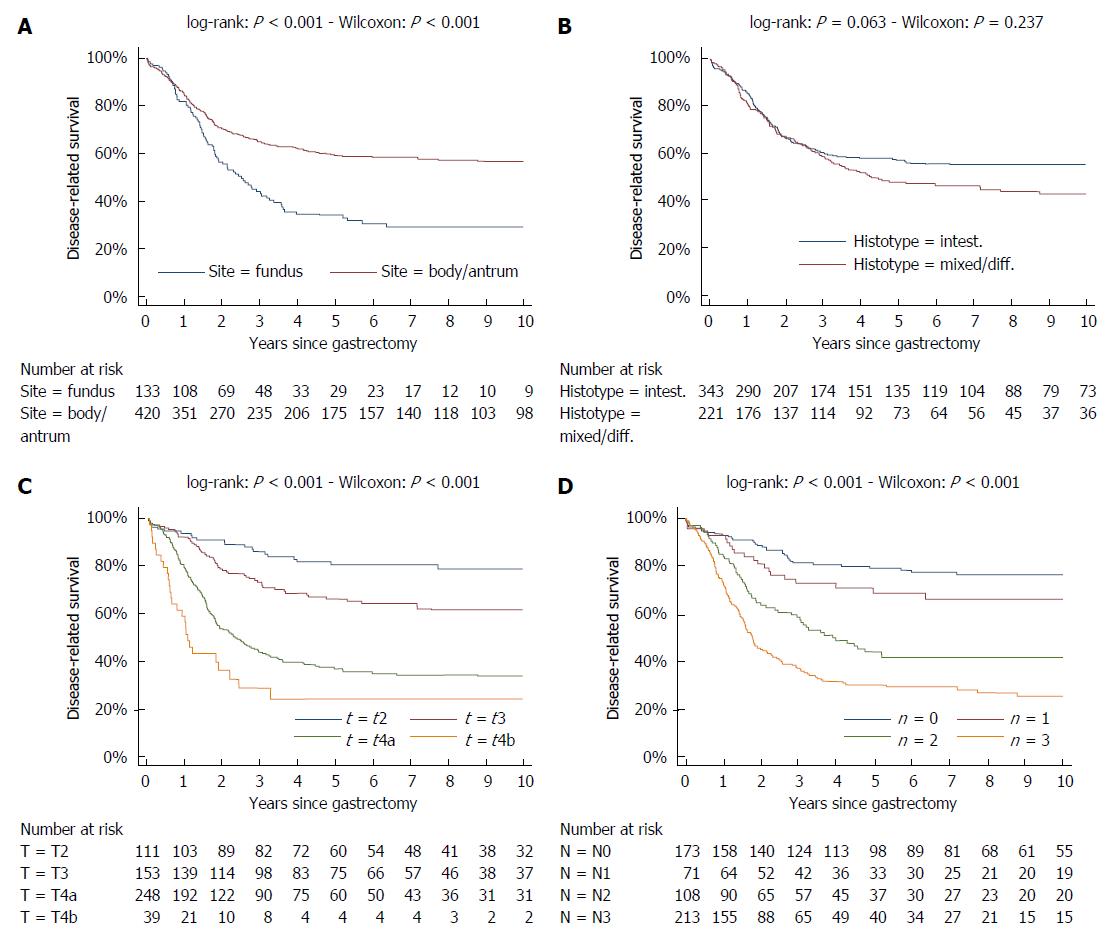
Figure 6 Survival curves, estimated by Kaplan-Meier method on a GIRCG series of 568 patients undergoing curative gastrectomy for gastric cancer.
The A, B, C and D display respectively survival curves as a function of site (fundus vs antrum/body), Lauren histotype (intestinal vs mixed/diffuse), depth of tumor invasion and nodal status.
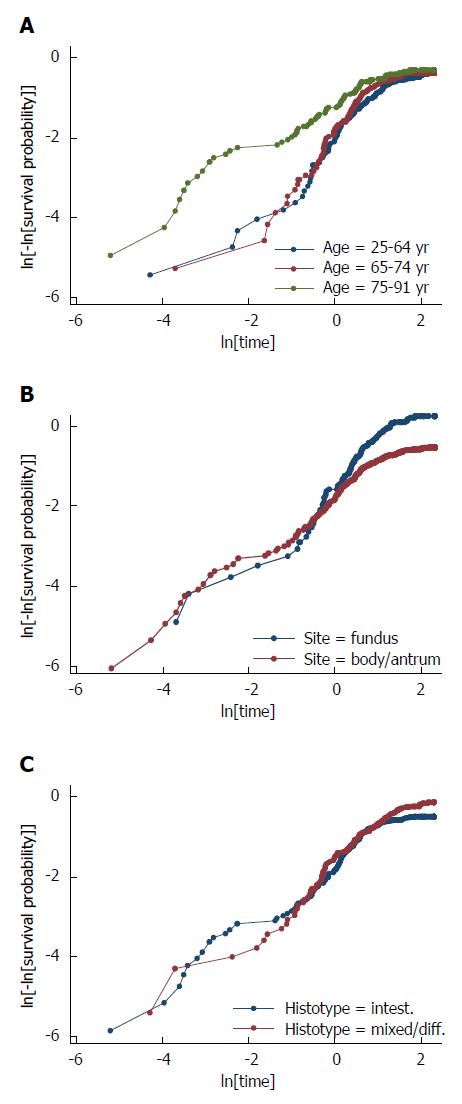
Figure 7 Log-log plots for age (A), site (B) and histology (C).
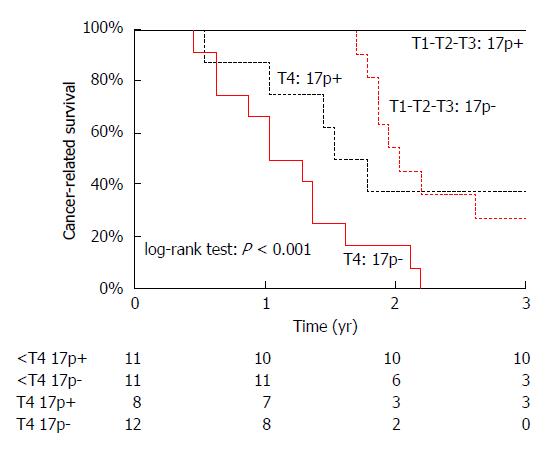
Figure 8 Kaplan-Meier survival curves, according to both T-stage and chromosome 17p allelic status in ampullary adenocarcinoma.
Modified from Iacono et al[18]. 17p-: Chromosome 17p allelic loss; 17p+: Chromosome 17p allelic retention.
- Citation: Verlato G, Marrelli D, Accordini S, Bencivenga M, Di Leo A, Marchet A, Petrioli R, Zoppini G, Muggeo M, Roviello F, de Manzoni G. Short-term and long-term risk factors in gastric cancer. World J Gastroenterol 2015; 21(21): 6434-6443
- URL: https://www.wjgnet.com/1007-9327/full/v21/i21/6434.htm
- DOI: https://dx.doi.org/10.3748/wjg.v21.i21.6434


