Copyright
©The Author(s) 2015.
World J Gastroenterol. May 28, 2015; 21(20): 6194-6205
Published online May 28, 2015. doi: 10.3748/wjg.v21.i20.6194
Published online May 28, 2015. doi: 10.3748/wjg.v21.i20.6194
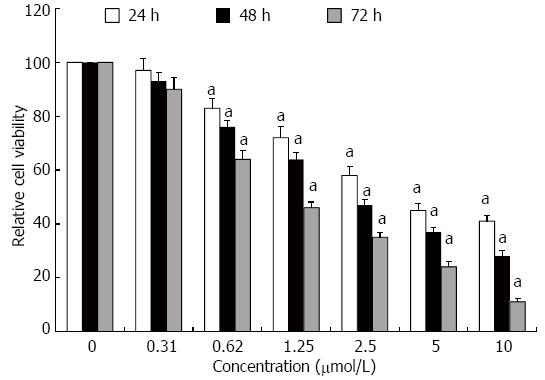
Figure 1 Gambogic acid-induced anti-proliferation of HT-29 cells.
Relative cell viability (%) was evaluated by MTT assay after treatment for 24, 48 and 72 h. All data were normalized to 0 μmol/L, which was considered as 100%. aP < 0.05 vs 0 μmol/L.
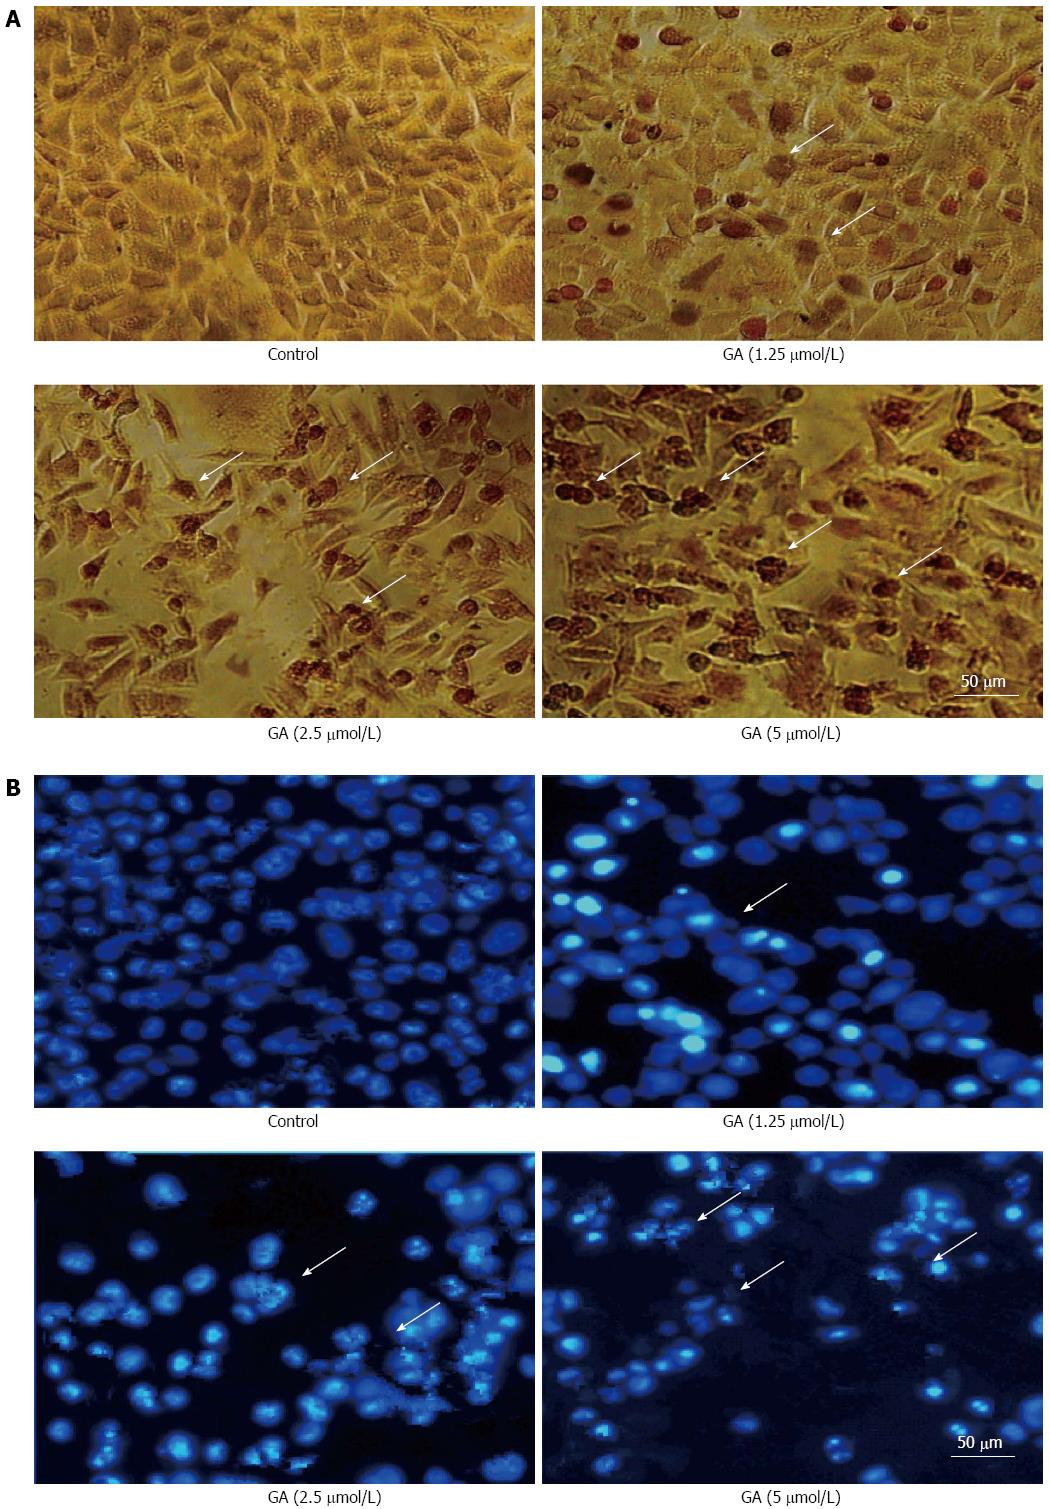
Figure 2 Gambogic acid-induced apoptosis.
Apoptotic HT-29 cells (arrows) were observed by A: Terminal deoxynucleotidyl transferase dUTP nick end labeling; and B: Hoechst 33342 staining after treatment with gambogic acid (GA) for 48 h.
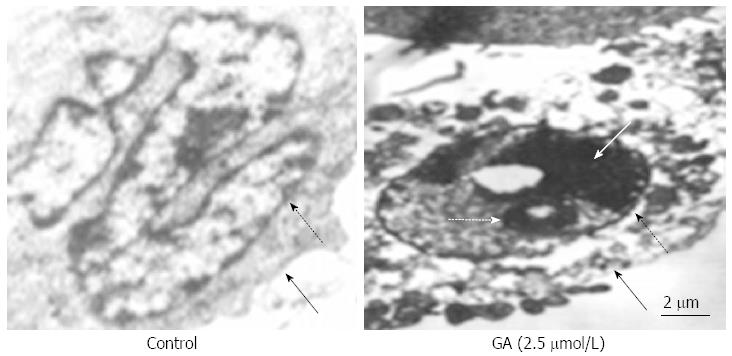
Figure 3 Ultrastructure of HT-29 cells.
Transmission electron microscopy revealed ultrastructural changes in HT-29 cells after treatment with 2.5 μmol/L gambogic acid (GA) for 48 h; dashed black arrow shows the nuclear membrane; black arrow shows the cellular membrane; dashed white arrow shows the apoptotic body; and the white arrow shows the condensed nucleus.
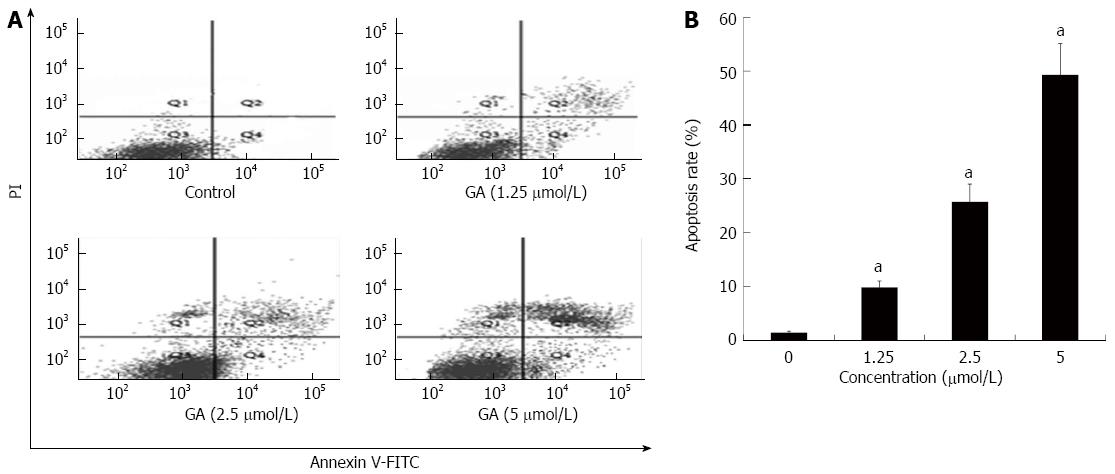
Figure 4 Quantification of gambogic acid-induced apoptosis by flow cytometry.
A: HT-29 cells were treated for 48 h and sorted by flow cytometry to detect early (FITC-stained, lower right quadrant) and late [FITC- and propidium iodide (PI)-stained, upper right quadrant] apoptotic cells; B: The experiment was repeated three times and the average percentage of apoptotic cells (mean ± SE) is shown. aP < 0.05 vs 0 μmol/L. GA: Gambogic acid.
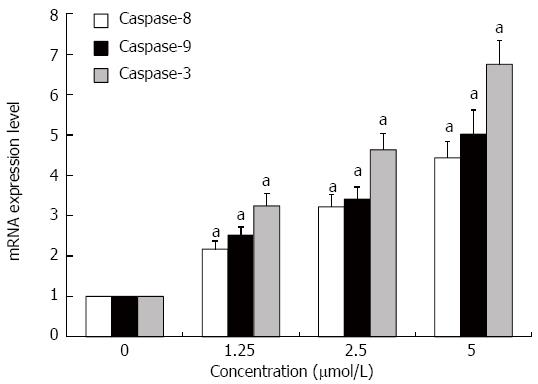
Figure 5 Gambogic acid increases the expression of caspase-9, -8 and -3 mRNAs in HT-29 cells.
HT-29 cells were treated for 48 h and mRNA expression was analyzed by quantitative real-time PCR. Expression levels were normalized to GAPDH and are relative to 0 μmol/L. aP < 0.05 vs 0 μmol/L.
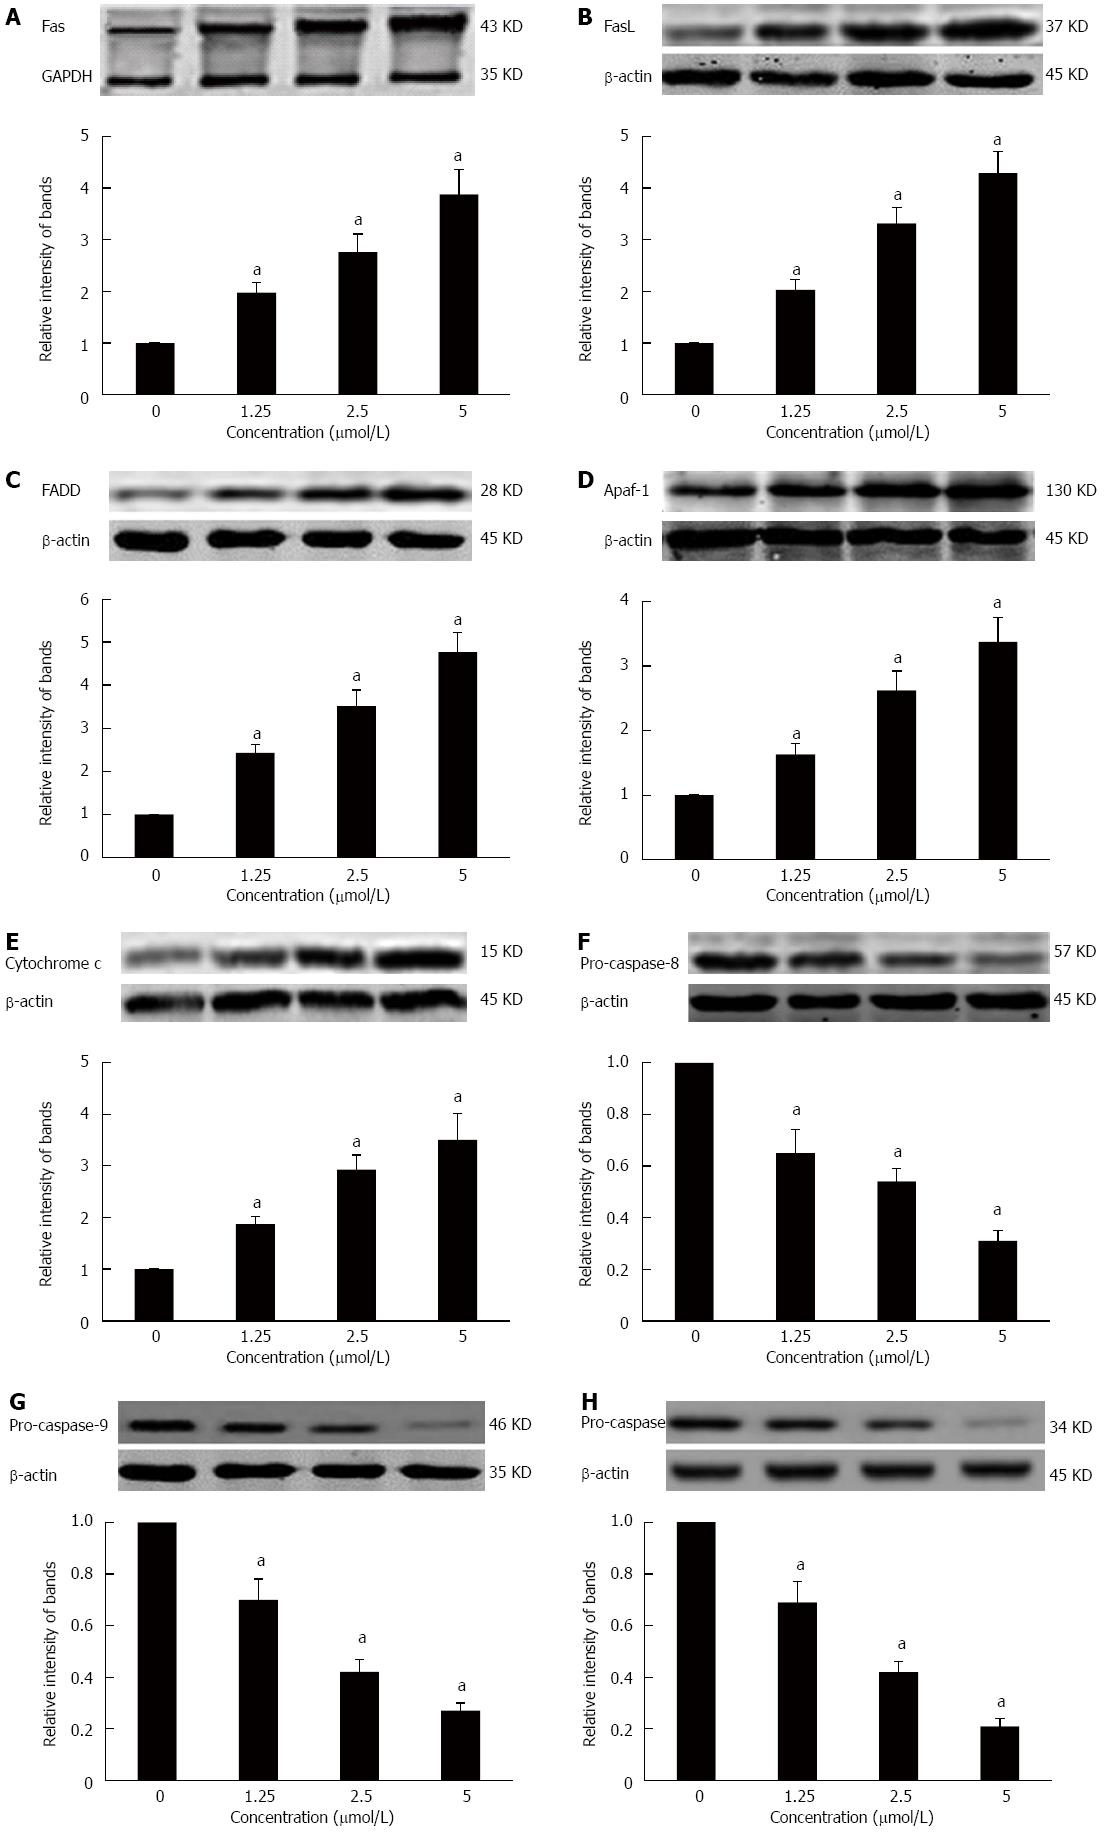
Figure 6 Effects of gambogic acid on the expression of apoptosis-related factors in HT-29 cells.
HT-29 cells were treated with gambogic acid (GA) for 48 h and Western blot was performed to measure levels of Fas receptor (A); Fas ligand (FasL) (B); FADD (C); apaf-1 (D); cytochrome c (E); pro-caspase-8 (F); pro-caspase-9 (G); and pro-caspase-3 (H). Data are reported as the mean ± SE of at least three experiments. aP < 0.05 vs 0 μmol/L.
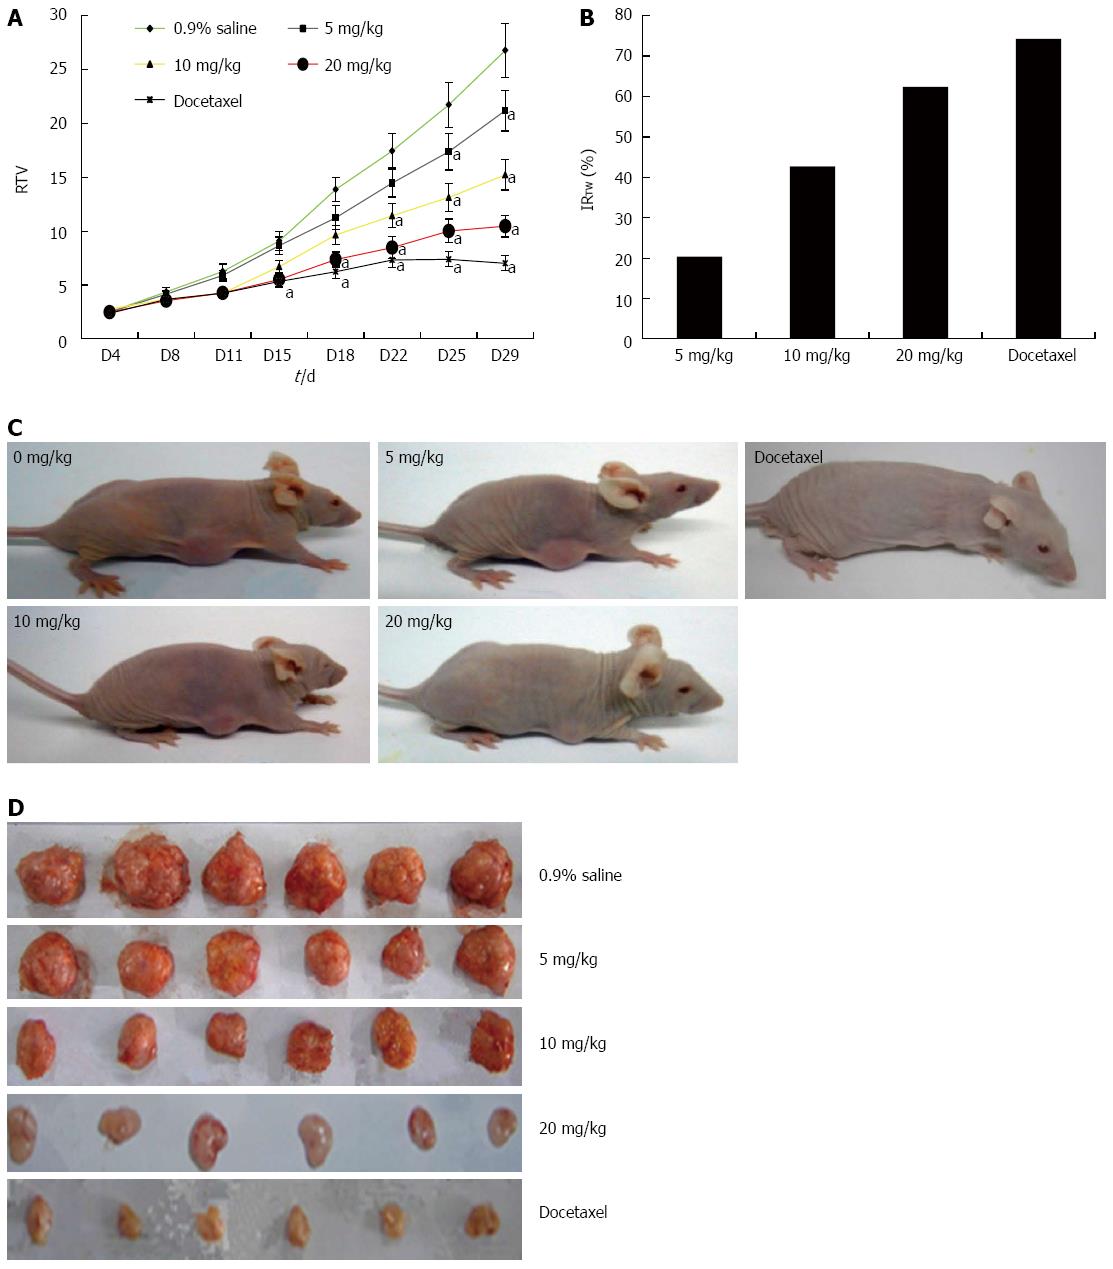
Figure 7 Gambogic acid inhibits the proliferation of HT-29 cells in BALB/c nude mice.
A: Relative tumor volume (RTV) (mean ± SE) over the 29 d experiment; B: Inhibition ratio of tumor weight (IRTW) from subcutaneously implanted HT-29 cells; Representative photographs of nude mice (C) and tumor samples (D) from the saline-, gambogic acid-, and docetaxel-treated groups. aP < 0.05 vs saline.
-
Citation: Huang GM, Sun Y, Ge X, Wan X, Li CB. Gambogic acid induces apoptosis and inhibits colorectal tumor growth
via mitochondrial pathways. World J Gastroenterol 2015; 21(20): 6194-6205 - URL: https://www.wjgnet.com/1007-9327/full/v21/i20/6194.htm
- DOI: https://dx.doi.org/10.3748/wjg.v21.i20.6194


