Copyright
©The Author(s) 2015.
World J Gastroenterol. May 28, 2015; 21(20): 6180-6193
Published online May 28, 2015. doi: 10.3748/wjg.v21.i20.6180
Published online May 28, 2015. doi: 10.3748/wjg.v21.i20.6180
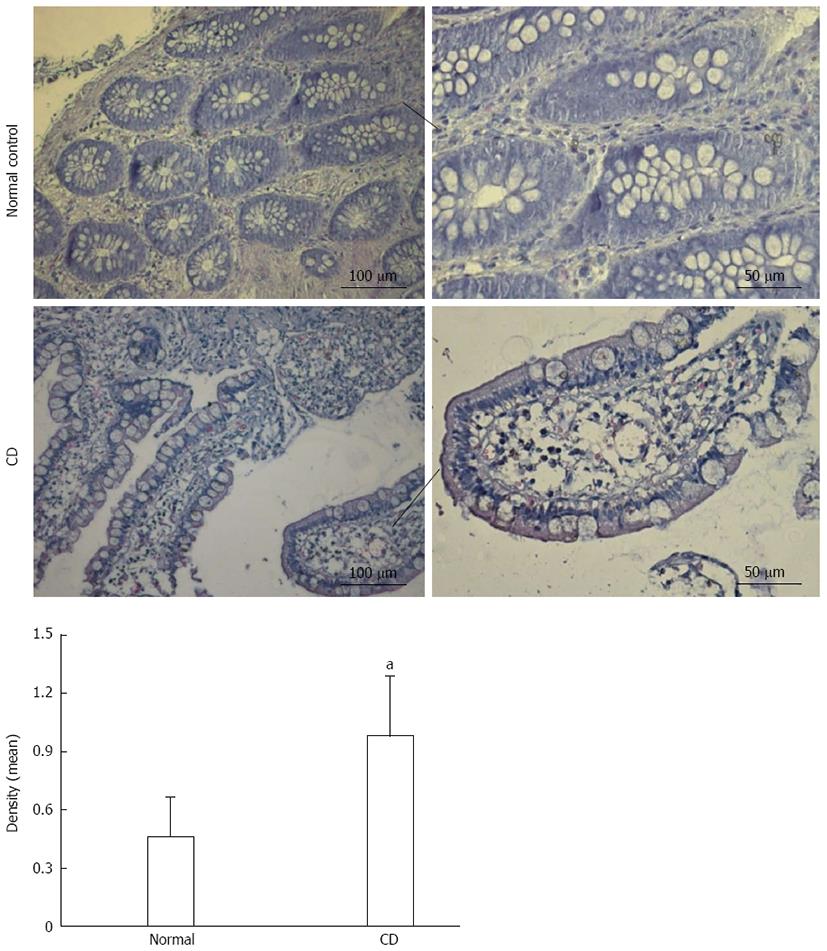
Figure 1 Serum-and-glucocorticoid-inducible-kinase-1 expression was increased in intestinal epithelial cells of patients with Crohn’s disease.
Immunohistochemistry of serum-and-glucocorticoid-inducible-kinase-1 (SGK1) in samples from patients with active Crohn’s disease (CD) and normal controls. Weak staining of SGK1 was detected in the samples from normal controls, while strong staining of SGK1 was observed in samples from patients with active CD. The CD group (n = 8) had 4 males and 4 females. The normal control group (n = 8) had 4 males and 4 females. aP < 0.05 vs normal controls. SGK1: Serum-and-glucocorticoid-inducible-kinase-1.
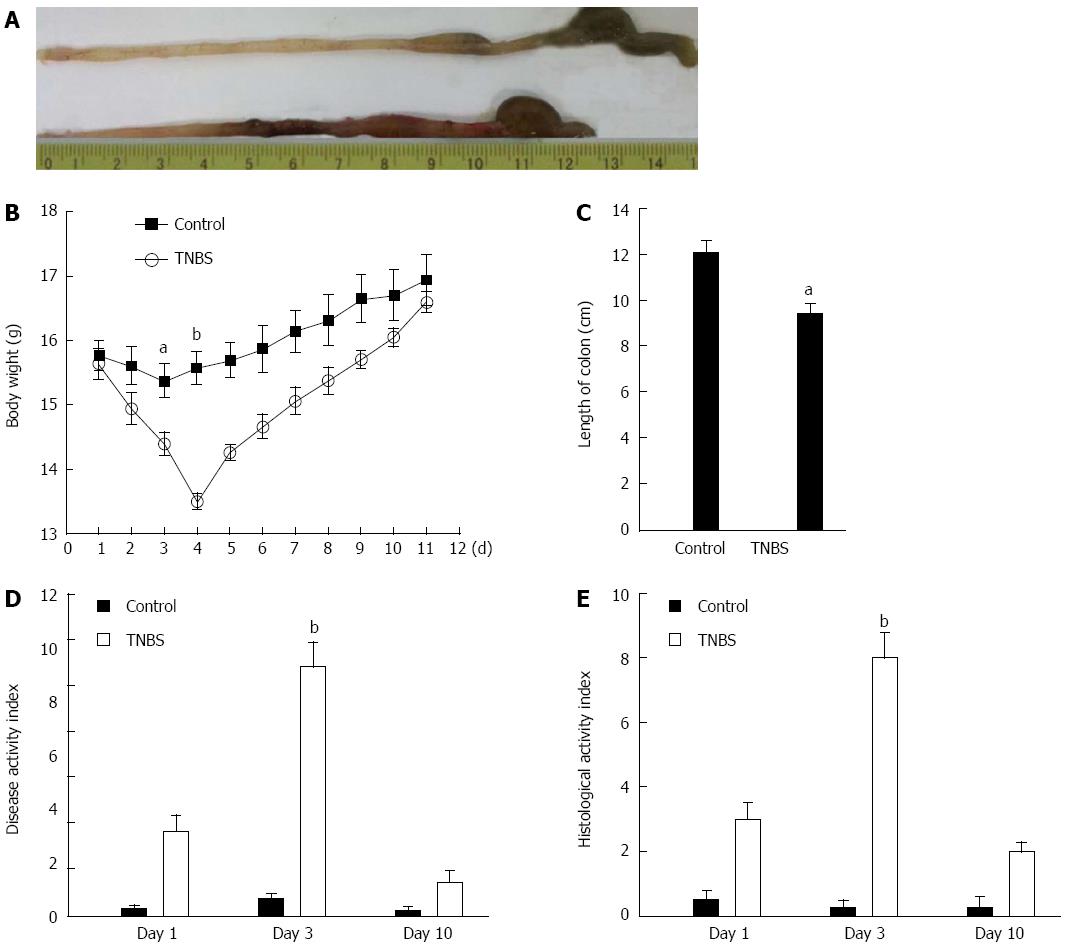
Figure 2 2,4,6-trinitrobenzene sulfonic acid and ethanol colitis model was successfully established.
The macroscopic appearance of the colon in TNBS-treated BALB/c mice. A: The colons were obtained 72 h after intra-rectal TNBS or ethanol treatment and were then photographed; B: TNBS or ethanol (the control group) administration caused variation in bodyweight in the murine model; C: Mean colon length; D, E: The DAI and HAI of mice treated with TNBS or ethanol were assessed. Data are presented as the mean ± SD (n = 4). One of three representative experiments is shown. aP < 0.05 and bP < 0.01 vs the ethanol treatment group. TNBS: 2,4,6-trinitrobenzene sulfonic acid.
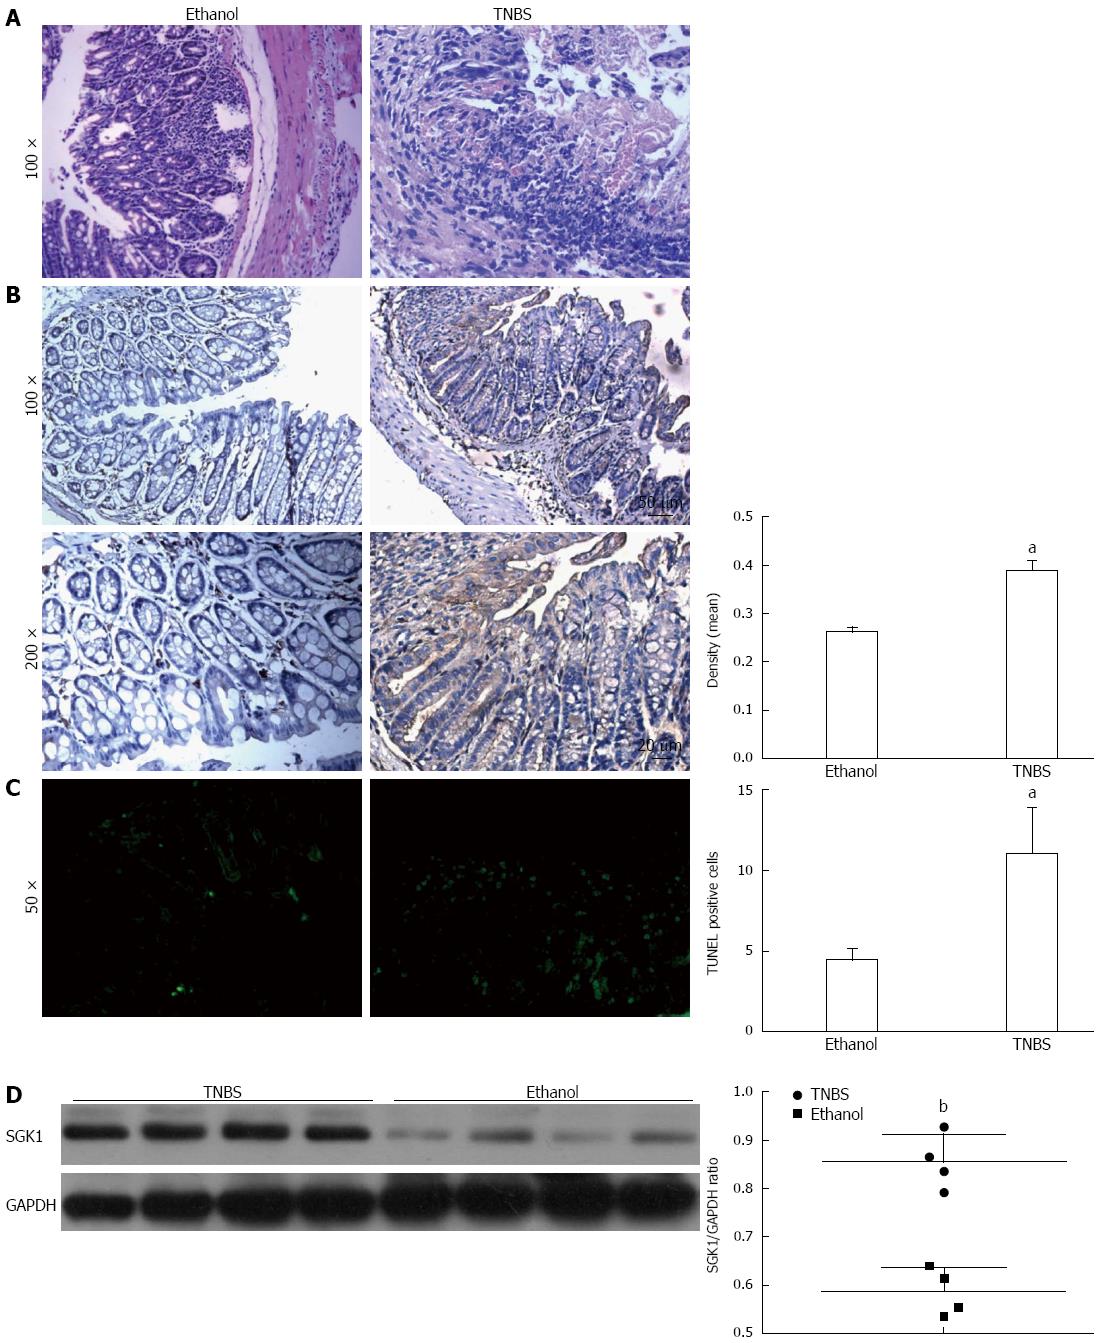
Figure 3 Serum-and-glucocorticoid-inducible-kinase-1 expression was increased in the colonic tissue of a 2,4,6-trinitrobenzene sulfonic acid-induced murine model.
A: Histological damage of colonic tissues induced by ethanol or 50% TNBS in mice (HE staining). Colonic tissues were obtained from the mice killed 3 d post-enema with ethanol or 50% TNBS; B: Immunohistochemical localization and upregulation of SGK1 expression in the colitis model. SGK1-dependent staining is indicated by brown areas. The density of positive areas was analyzed with Image Pro Plus; C: The TNBS group showed an increase in TUNEL positive cells. The positive cells were counted, and the results are presented as mean ± SD from six sample fields; D: Western blot analysis was performed to study the SGK1 level in TNBS-induced colitis compared with ethanol-treated mice. The ethanol-treated group served as controls in these experiments. aP < 0.05 and bP < 0.01 vs the ethanol treatment group. GAPDH served as the internal control.
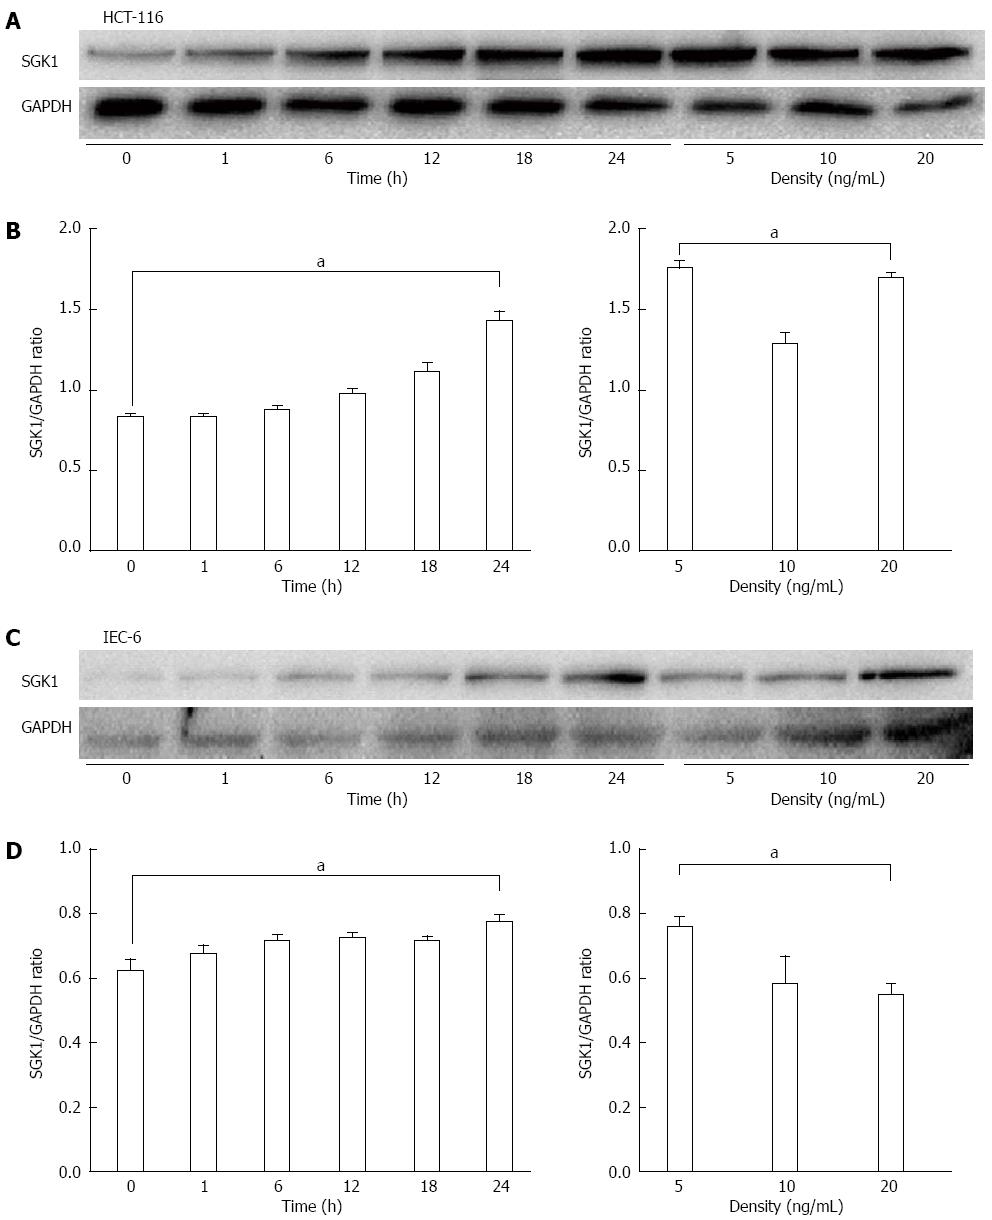
Figure 4 Serum-and-glucocorticoid-inducible-kinase-1 expression levels in tumor necrosis factor-treated intestinal epithelial cells assessed with western blotting.
A, B: SGK1 expression levels at different times and doses of TNF in HCT-116 cells; C, D: SGK1 expression levels at different times and doses of TNF in IEC-6 cells. aP < 0.05 and bP < 0.01 represented 24 h vs 0 h after TNF-treatment or 10 ng vs 5 ng TNF. GAPDH served as the internal control. SGK1: Serum-and-glucocorticoid-inducible-kinase-1; TNF: Tumor necrosis factor; IECs: Intestinal epithelial cells.
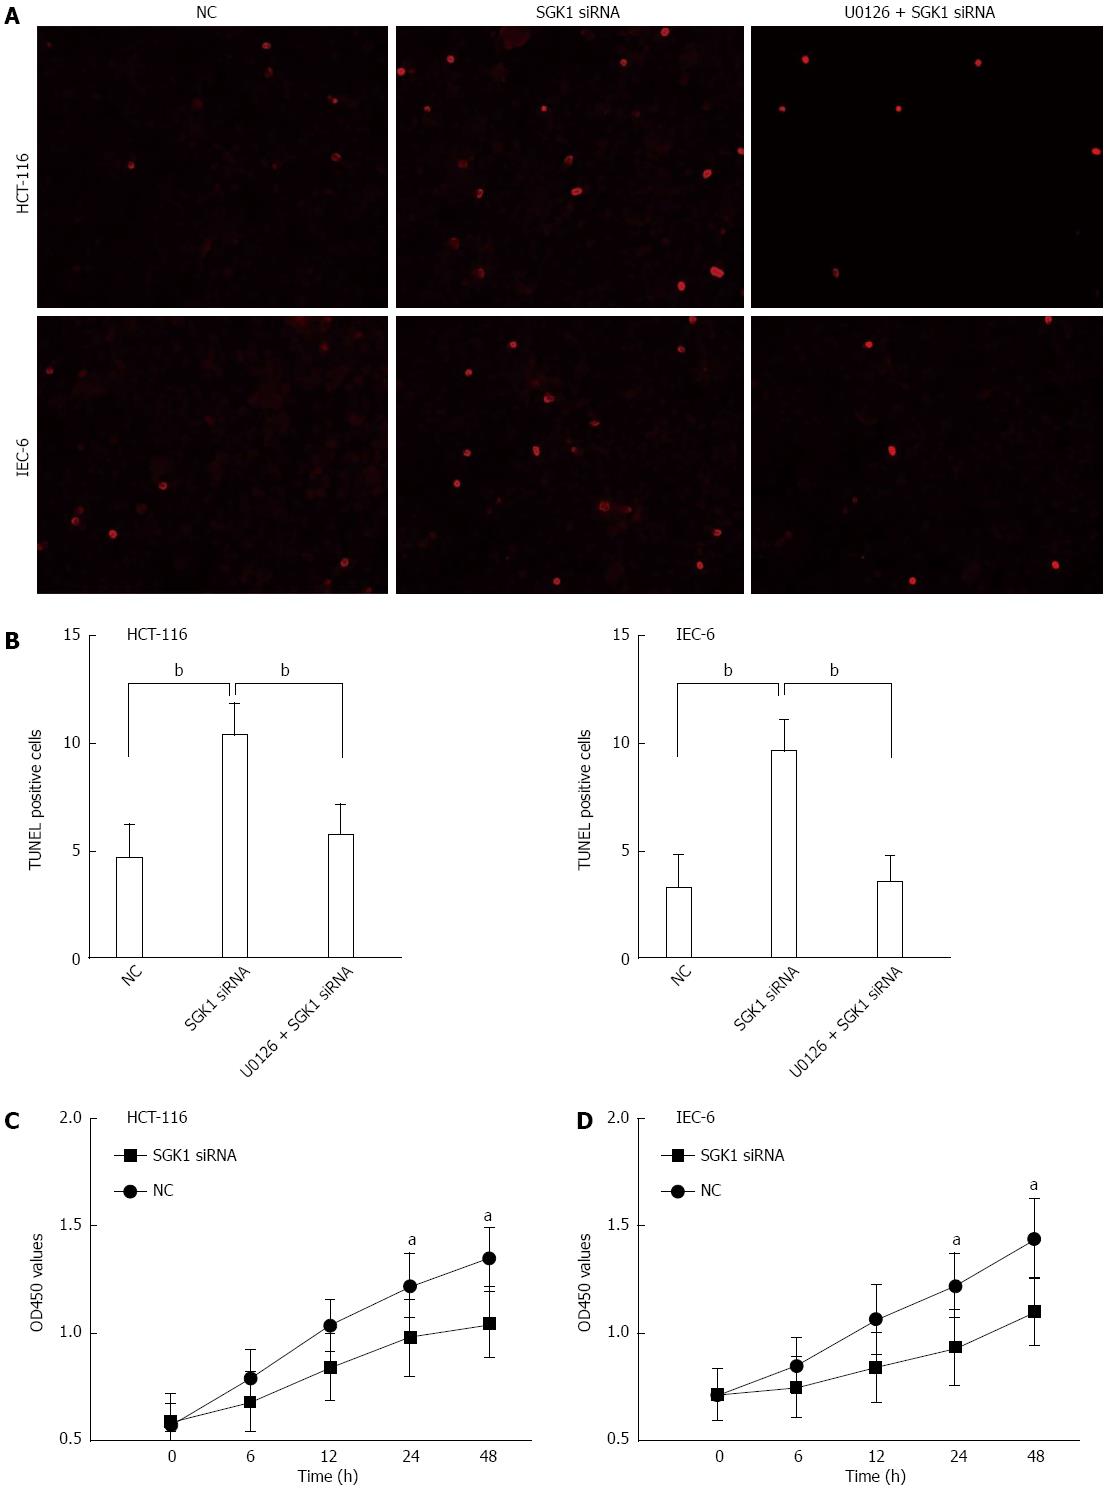
Figure 5 Intestinal epithelial cell apoptosis and proliferation analyzed by TUNEL and CCK-8 assays.
A: After the indicated treatment for 48 h, the cells were TdT-UTP nick end labeled and photographed with a fluorescent microscope. Scale bar = 200 μm. The TUNEL-positive cells are colored green; B: Quantitation of TUNEL-positive intestinal epithelial cells (IECs) was performed on all groups. All values are mean ± SD from 6 independent images in each group; C: For the CCK-8 assay, IECs were transfected with SGK1 siRNA or negative control siRNA (NC) as described above. OD450 values indicate the absorbance of IECs post-transfected at a wavelength of 450 nm. The OD450 values of IEC-6 and HCT-116 cells are shown in C and D, respectively. aP < 0.05 and bP < 0.01 vs negative controls.
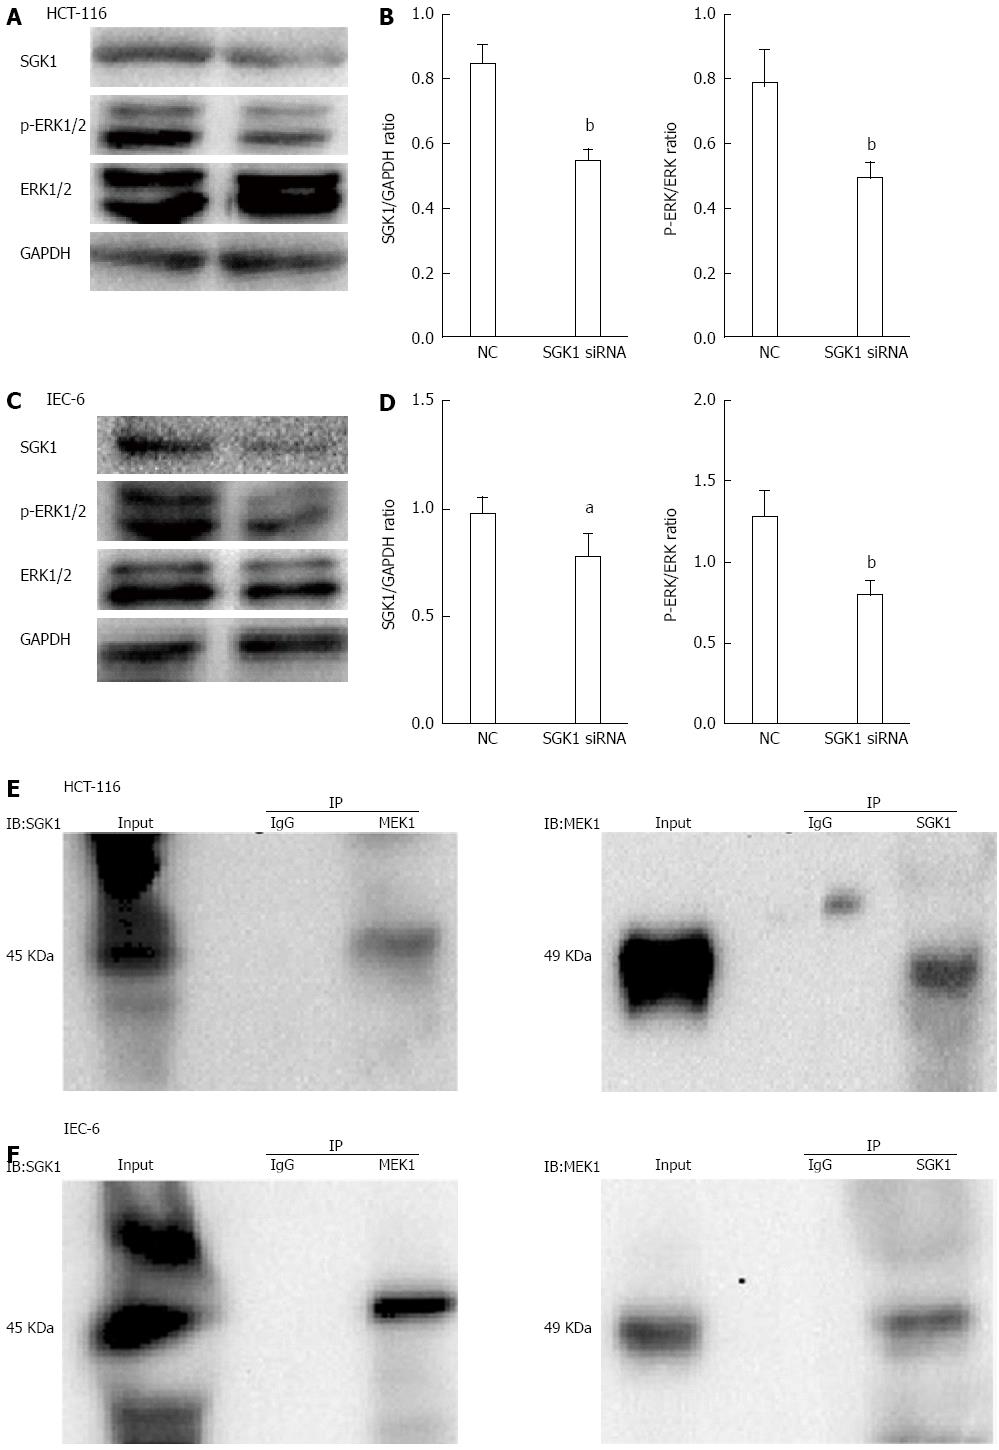
Figure 6 Efficiency of serum-and-glucocorticoid-inducible-kinase-1 silencing after serum-and-glucocorticoid-inducible-kinase-1 siRNA transfection and co-immunoprecipitation of serum-and-glucocorticoid-inducible-kinase-1 and mitogen-activated protein kinase kinase 1.
A, B: The efficiency of SGK1 silencing the subsequent dysregulation of p-ERK and ERK in HCT-116 cells. The efficiency of SGK1 silencing was assessed by the ratio of SGK1/GAPDH. The level of ERK phosphorylation was assessed by the ratio of p-ERK/ERK; C, D: The efficiency of SGK1 silencing and the following dysregulation of p-ERK and ERK in IEC-6 cells. The NC group served as controls. GAPDH served as the internal control; E, F: SGK1 was co-immunoprecipitated with MEK1 on IECs. HCT-116 and IEC-6 cell lysates were subjected to co-immunoprecipitation with anti-SGK1 or control IgG and were detected with anti-MEK1 antibodies. MEK1 was co-immunoprecipitated with SGK1. aP < 0.05 and bP < 0.01 vs negative controls.
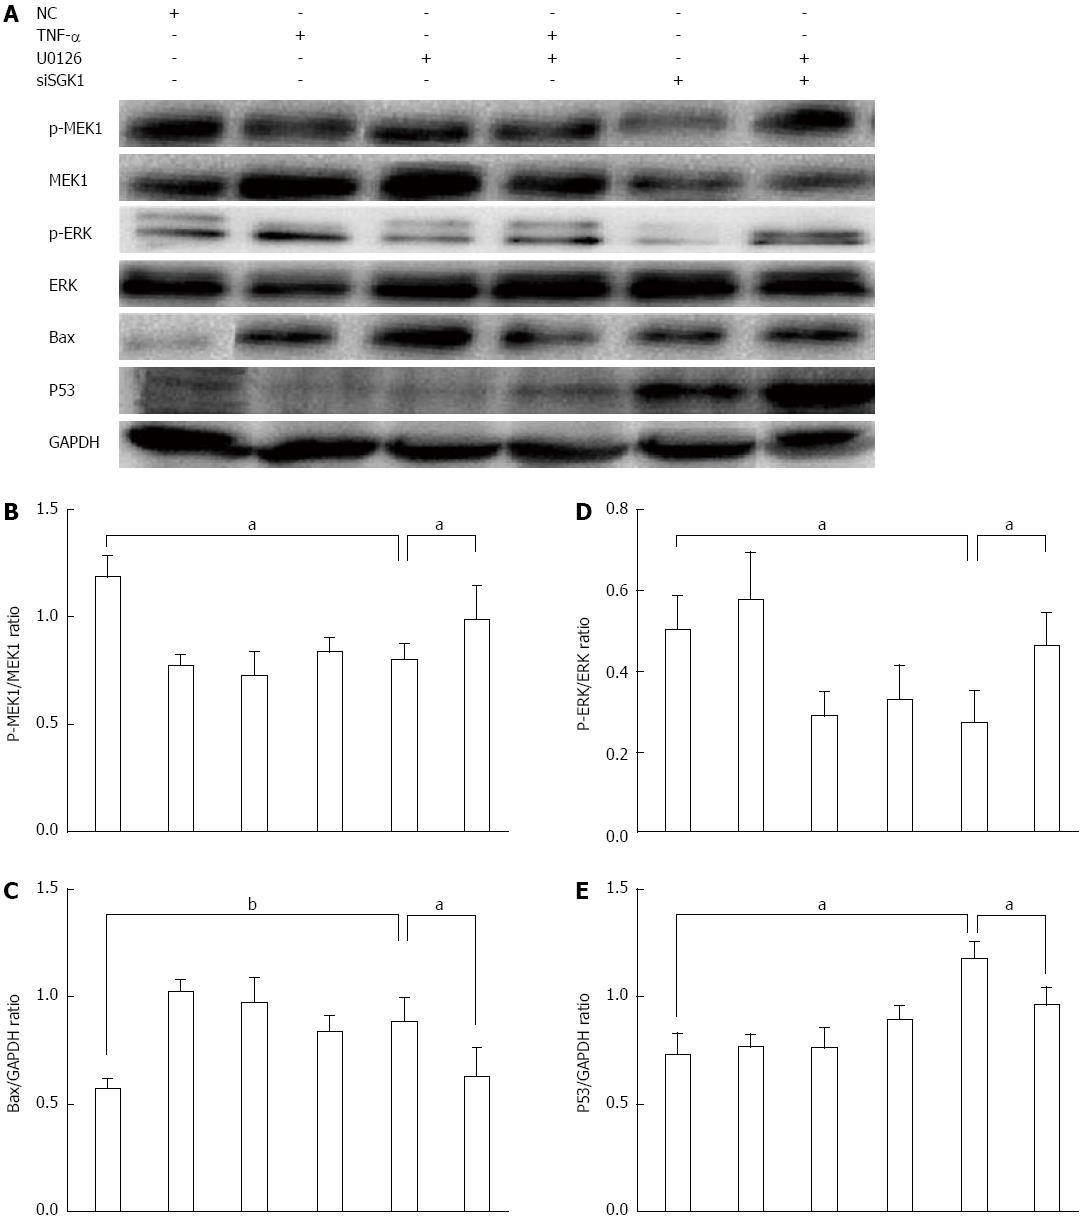
Figure 7 P53 and Bax are downstream of the mitogen-activated protein kinase kinase 1/extracellular signal regulated protein kinase pathway.
A: IECs in culture were pretreated with the MEK1 inhibitor (U0126) followed by stimulation with TNF-α and NC or SGK1 siRNA. Protein expression levels were then detected by western blotting; B: The level of MEK1 phosphorylation was assessed by the ratio of p-MEK1/MEK1; D: The level of ERK1/2 phosphorylation was assessed by the ratio of p-ERK/ERK; C, E: p53 and Bax expression levels were assessed by the ratios of p53/GAPDH and Bax/GAPDH, respectively. aP < 0.05 and bP < 0.01, siSGK1-treated group vs negative controls or the U0126-treated group vs the non-U0126-treated group before siSGK1 transfection. SGK1: Serum-and-glucocorticoid-inducible-kinase-1; TNF: Tumor necrosis factor; IECs: Intestinal epithelial cells; MEK: Mitogen-activated protein kinase kinase 1; ERK: Extracellular signal regulated protein kinase; GAPDH: Glyceraldehyde-3-phosphate dehydrogenase.
-
Citation: Bai JA, Xu GF, Yan LJ, Zeng WW, Ji QQ, Wu JD, Tang QY. SGK1 inhibits cellular apoptosis and promotes proliferation
via the MEK/ERK/p53 pathway in colitis. World J Gastroenterol 2015; 21(20): 6180-6193 - URL: https://www.wjgnet.com/1007-9327/full/v21/i20/6180.htm
- DOI: https://dx.doi.org/10.3748/wjg.v21.i20.6180


