Copyright
©The Author(s) 2015.
World J Gastroenterol. Jan 14, 2015; 21(2): 616-622
Published online Jan 14, 2015. doi: 10.3748/wjg.v21.i2.616
Published online Jan 14, 2015. doi: 10.3748/wjg.v21.i2.616
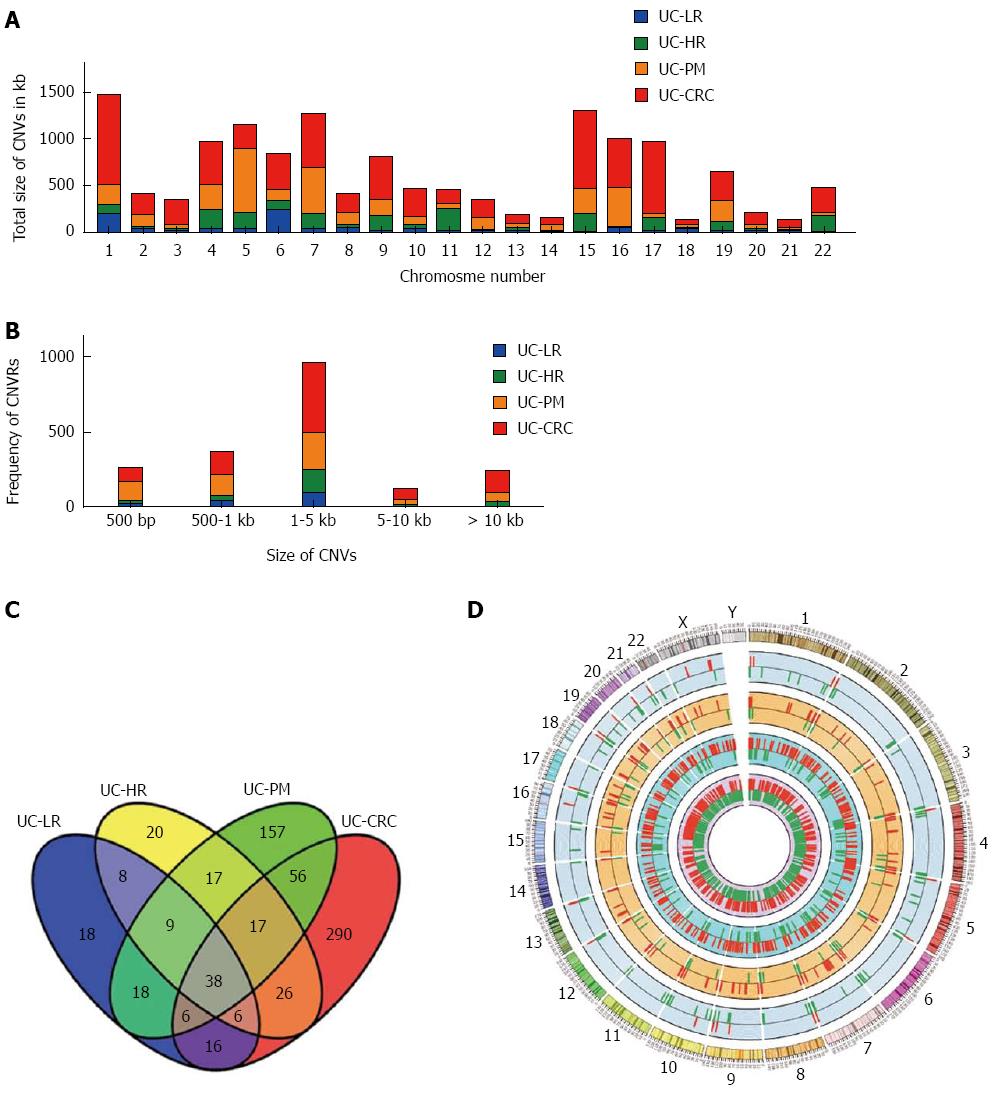
Figure 1 Size distribution and overlap analysis of copy number variable regions and associated genes.
A: Each chromosome wide copy number variation (CNV) size distribution across samples from ulcerative colitis (UC) to colitis associated colorectal cancer (CAC); B: Histogram representation of distribution of CNV sizes on all 4 samples analyzed by CNV association microarrays; C: Venn diagram showing the number of unique and common genes in different groups from UC to CAC. D: CIRCOS plot highlighting progressive CNV association analysis during UC progression to CRC using 2×10⁵ k arrays (UC-LR, UC-HR, UC-PM and UC-CRC or CAC: in the order from outer circle to inner circle). LR: Low risk; HR: High risk; PM: Premalignant.
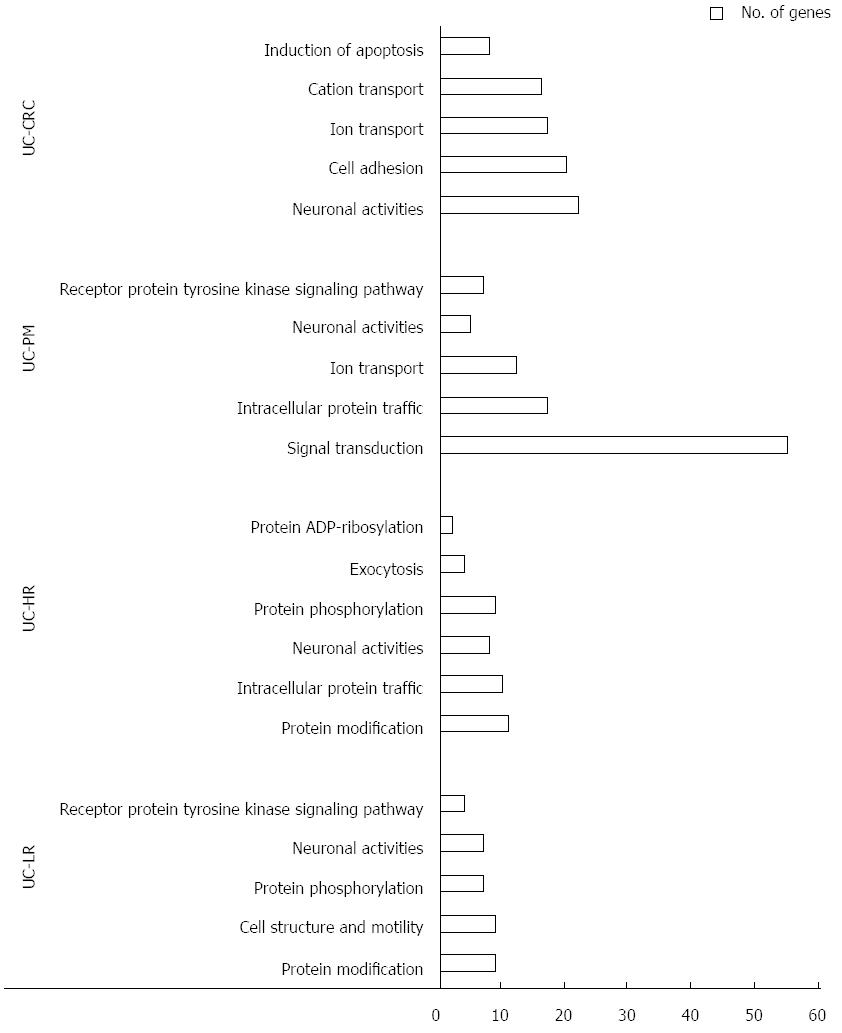
Figure 2 Summary results of gene ontology analysis carried out on 2 × 10⁵ k data from different ulcerative colitis sample groups.
X-axis: Molecular function and Y-axis: Number of genes involved. UC: Ulcerative colitis; CAC: Colitis-associated colorectal cancer; LR: Low risk; HR: High risk; PM: Premalignant.
- Citation: Shivakumar BM, Rotti H, Vasudevan TG, Balakrishnan A, Chakrabarty S, Bhat G, Rao L, Pai CG, Satyamoorthy K. Copy number variations are progressively associated with the pathogenesis of colorectal cancer in ulcerative colitis. World J Gastroenterol 2015; 21(2): 616-622
- URL: https://www.wjgnet.com/1007-9327/full/v21/i2/616.htm
- DOI: https://dx.doi.org/10.3748/wjg.v21.i2.616


