Copyright
©The Author(s) 2015.
World J Gastroenterol. Jan 14, 2015; 21(2): 517-524
Published online Jan 14, 2015. doi: 10.3748/wjg.v21.i2.517
Published online Jan 14, 2015. doi: 10.3748/wjg.v21.i2.517
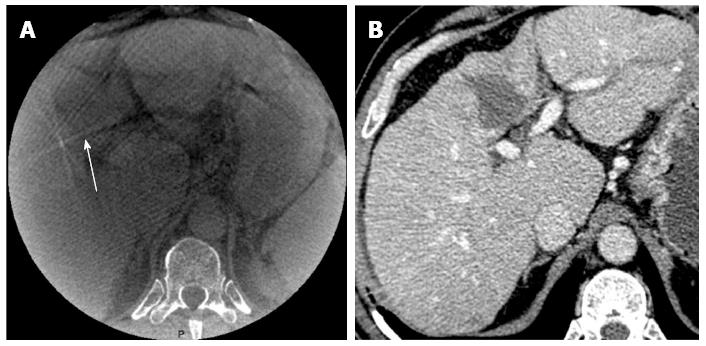
Figure 1 Illustration of a poor quality cone beam computed tomography image obtained in a 65-year-old man with hepatocellular carcinoma on hepatitis C virus cirrhosis background.
A: Visibility of the ablation zone is poor (arrow); B: Post-ablation multi-detector computed tomography performed at 6 wk showed complete ablation.
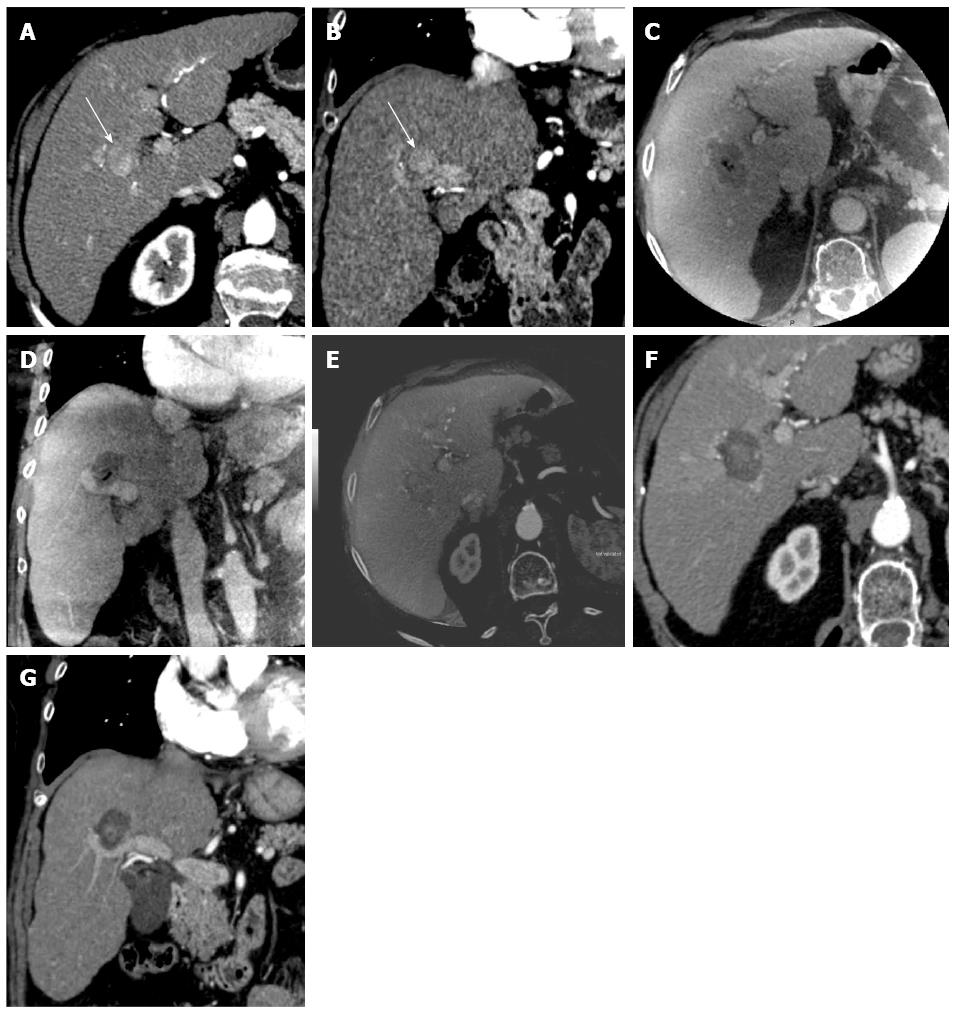
Figure 2 A 53-year-old man with small hepatocellular carcinoma in the right liver.
On baseline arterial phase axial and coronal contrast-enhanced multidetector computed tomography (MDCT) (A and B), the tumor was hypervascular (arrow). On axial and coronal contrast-enhanced cone beam computed tomography (CBCT) immediately after radiofrequency ablation (C and D), the ablation zone was clear and markedly hypoattenuating. Image fusion performed between baseline arterial phase contrast-enhanced MDCT and contrast-enhanced CBCT showed satisfactory tumor coverage (E). The ablation zone is clearly visible on 1-mo post-procedural axial and coronal contrast-enhanced MDCT (F and G). The volume of necrosis obtained from contrast-enhanced CBCT and 1-mo post-procedural contrast-enhanced MDCT was similar.
Figure 3 Comparison of cone beam computed tomography with baseline multidetector computed tomography, and 1-2 mo multidetector computed tomography.
A: Correlation between ablation zone volumes calculated from cone beam computed tomography (CBCT) images and those from 1-2 mo post-procedural multidetector computed tomography (MDCT) images; B: Bland and Altman limits of agreement for the ablation zone volumes measured on CBCT and MDCT.
- Citation: Abdel-Rehim M, Ronot M, Sibert A, Vilgrain V. Assessment of liver ablation using cone beam computed tomography. World J Gastroenterol 2015; 21(2): 517-524
- URL: https://www.wjgnet.com/1007-9327/full/v21/i2/517.htm
- DOI: https://dx.doi.org/10.3748/wjg.v21.i2.517


