Copyright
©The Author(s) 2015.
World J Gastroenterol. Jan 14, 2015; 21(2): 439-452
Published online Jan 14, 2015. doi: 10.3748/wjg.v21.i2.439
Published online Jan 14, 2015. doi: 10.3748/wjg.v21.i2.439
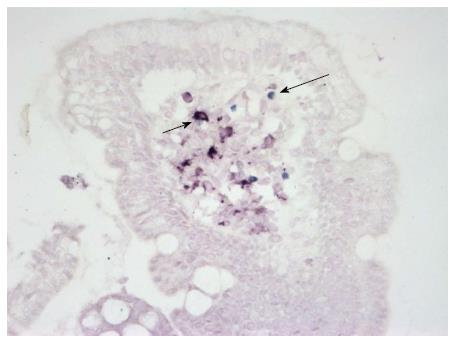
Figure 1 Double staining for CD11c (purple-red, short arrow) and FOXP3 (blue, long arrow) on a paraffin section of the small bowel mucosa.
Original magnification, objective × 40; eyepiece × 10.
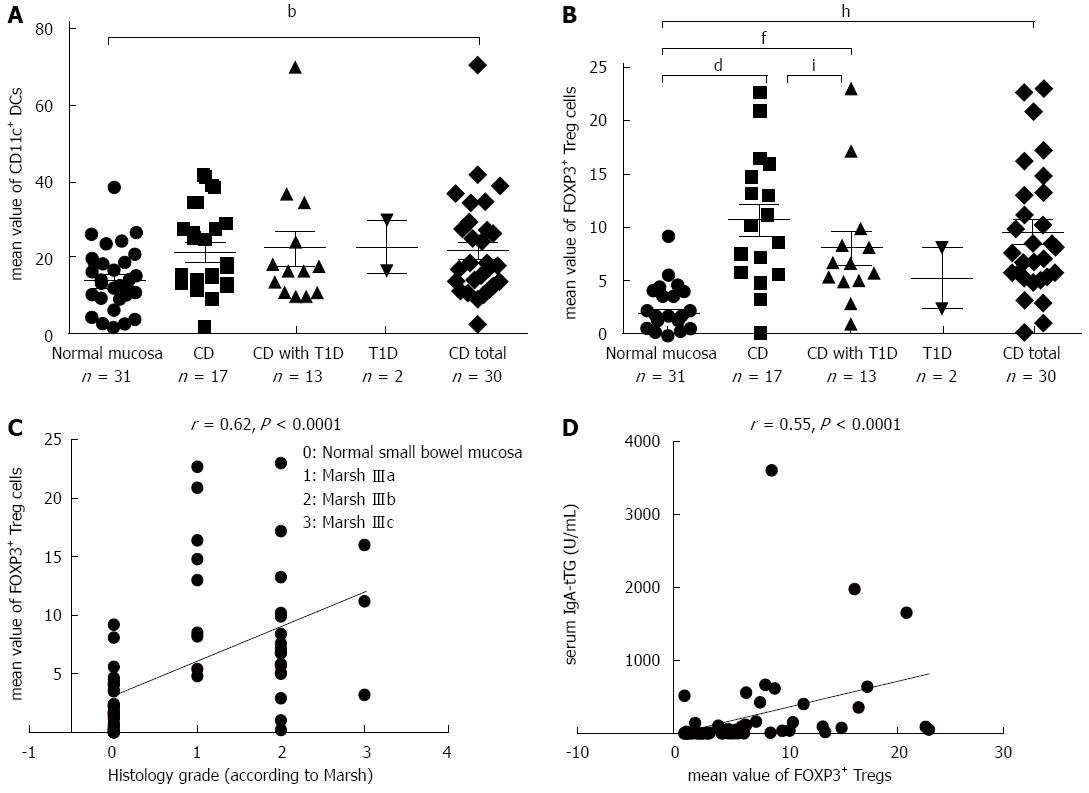
Figure 2 Density of CD11c+ dendritic cells (A), FOXP3+ regulatory T cells (B) in paraffin sections for the different study groups; Spearman’s rank correlation between the histological grades (according to Marsh) and FOXP3+ regulatory T cells cell densities (C) or between the densities of FOXP3+ regulatory T cells and serum IgA-tTG levels (D) in the studied persons.
bP < 0.01, CD total vs normal mucosa; dP < 0.01, CD vs normal mucosa; fP < 0.01, CD with T1D vs normal mucosa; hP < 0.01, CD total vs normal mucosa; iP value for CD vs CD with T1D not statistically significant. CD: Celiac disease; T1D: Type 1 diabetes; DC: Dendritic cell; IgA-tTG: IgA antibody; Tregs: regulatory T cells.
Figure 3 Positive staining for indoleamine 2, 3-dioxygenase (purple-red) on a paraffin section of the small bowel mucosa.
Original magnification, objective × 40; eyepiece × 10.
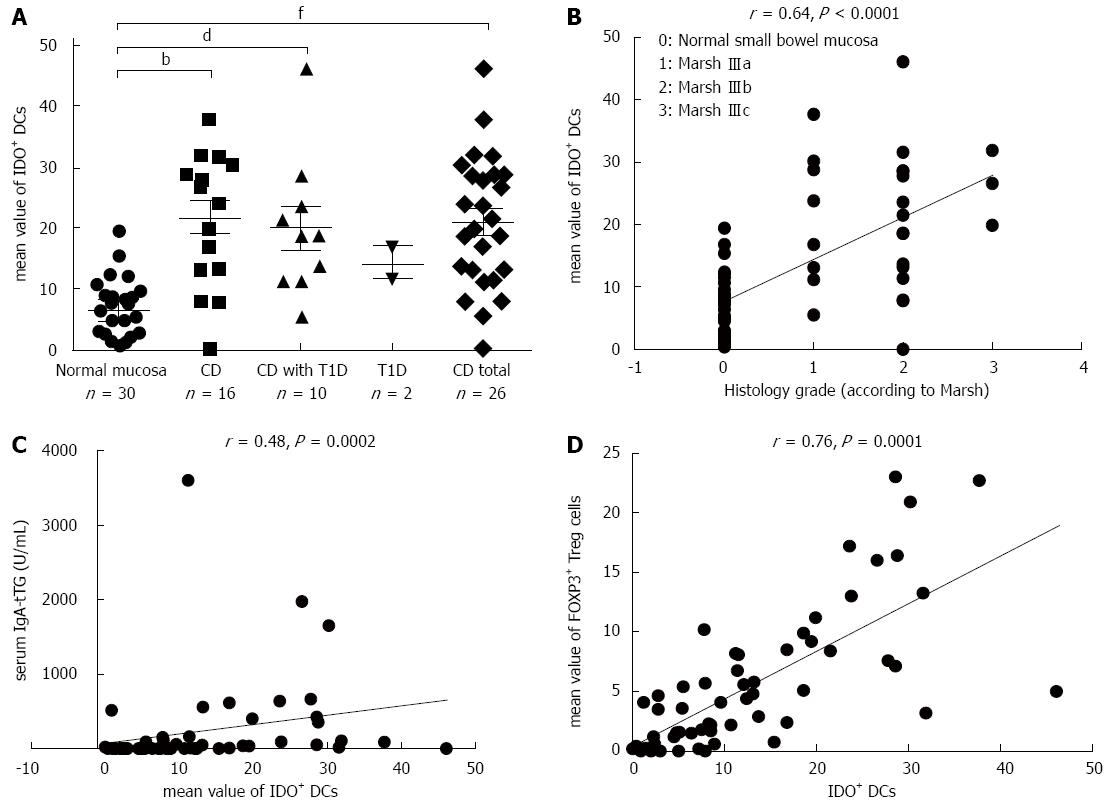
Figure 4 Densities of IDO+ DCs on paraffin sections for the different study groups (A); Spearman’s rank correlation between the histological grades (according to Marsh) and IDO+ DCs (on paraffin sections) for the studied persons (B); between the densities of IDO+ DCs and serum IgA-tTG levels in the studied persons (C); or between the densities of IDO+ DCs and FOXP3+ Treg cells for the entire study group, evaluated on paraffin sections (r = 0.
76; P = 0.0001) (D). The dots represent the mean values of positively stained cells per microscopic field. bP < 0.01, CD vs normal mucosa; dP < 0.01, CD with T1D vs normal mucosa; fP < 0.01, CD total vs normal mucosa. CD: Celiac disease; DC: Dendritic cell; T1D: Type 1 diabetes; IgA-tTG: IgA antibody; Tregs: regulatory T cells; IDO: Indoleamine 2,3-dioxygenase.
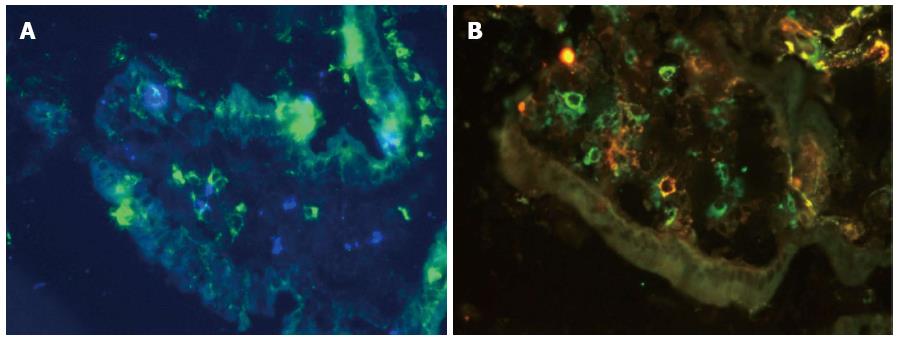
Figure 5 Double-staining for IDO (blue) and CD103 (green) (merged, A) and double-staining for CD11c (red) and CD103 (green) (merged, B) on cryostat sections of the small bowel mucosa.
Original magnification, objective × 40; eyepiece × 10. IDO: Indoleamine 2,3-dioxygenase.
Figure 6 Densities of CD103+ DCs on cryostat sections for the different study groups (A); Spearman’s rank correlation between the histological grades (according to Marsh) and the densities of CD103+ DCs for the studied persons (B); or between the densities of CD103+ DCs and FOXP3+ Treg cells for the entire study group (C).
The dots represent the mean values of positively stained cells per microscopic field. bP≤ 0.01, CD vs normal mucosa; dP < 0.01, CD with T1D vs normal mucosa; fP < 0.01, CD total vs normal mucosa. CD: Celiac disease; T1D: Type 1 diabetes; DC: Dendritic cell; Tregs: regulatory T cells..
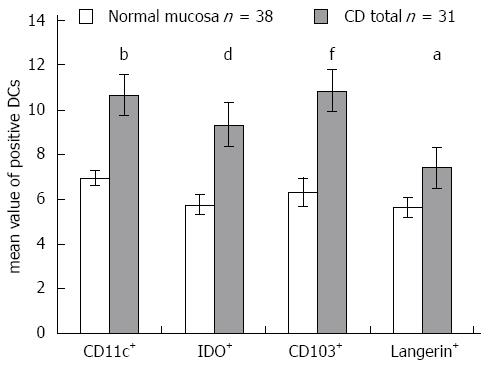
Figure 7 Mean values of CD11c+, IDO+, CD103+ and Langerin+ DCs in celiac disease patients are significantly higher compared with these values in persons with normal small bowel mucosa (according to the immunofluorescence data from cryostat sections).
Columns represent the mean values of positively stained cells per microscopic field in patients with CD vs patients with normal mucosa. bP < 0.01, CD11c+ in patients with CD vs patients with normal mucosa; dP < 0.01, IDO+ in patients with CD vs patients with normal mucosa; fP < 0.01, CD103+ in patients with CD vs patients with normal mucosa; aP < 0.05, Langerin+ CD103+ in patients with CD vs patients with normal mucosa. CD: Celiac disease; IDO: Indoleamine 2,3-dioxygenase; DC: Dendritic cell.
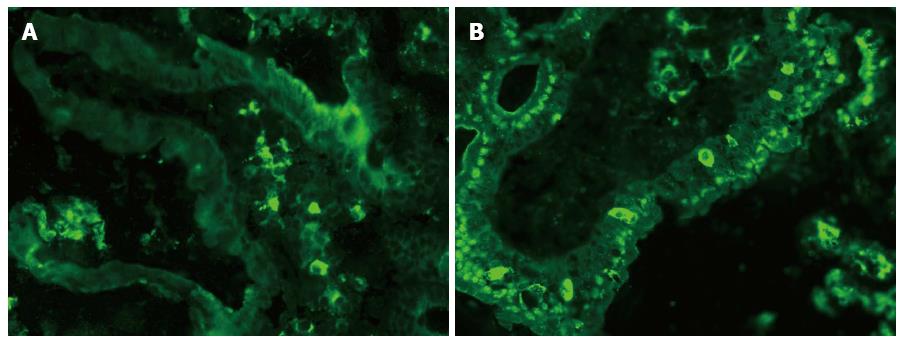
Figure 8 Staining for Langerin (CD207) on cryostat sections of the small bowel mucosa in the lamina propria (A) and in the epithelium of the villus of the small bowel mucosa (B).
Original magnification, objective × 40; eyepiece × 10.
Figure 9 Densities of Langerin+ dendritic cells on paraffin sections for the different study groups.
The dots represent the mean values of positively stained cells per microscopic field. aP < 0.05, CD total vs normal mucosa. CD: Celiac disease; T1D: Type 1 diabetes; DC: Dendritic cell.
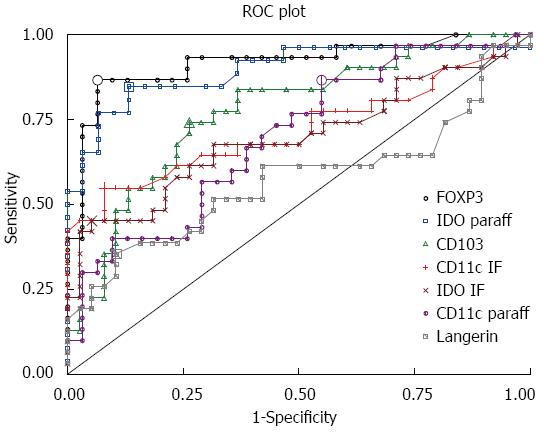
Figure 10 Receiver operating characteristic curves of dendritic cell and Tregs markers, showing their overall capacity to discriminate between individuals with and without the disease.
The diagonal line represents a worthless test (sensitivity = 1 - specificity). The further the curve is from the diagonal line and the closer it is to the upper left- hand corner of the graph, the better the discriminative power of the test. CD: Celiac disease; IDO: Indoleamine 2,3-dioxygenase; ROC: Receiver operating characteristic.
- Citation: Vorobjova T, Uibo O, Heilman K, Uibo R. Increased density of tolerogenic dendritic cells in the small bowel mucosa of celiac patients. World J Gastroenterol 2015; 21(2): 439-452
- URL: https://www.wjgnet.com/1007-9327/full/v21/i2/439.htm
- DOI: https://dx.doi.org/10.3748/wjg.v21.i2.439


