Copyright
©The Author(s) 2015.
World J Gastroenterol. May 7, 2015; 21(17): 5432-5441
Published online May 7, 2015. doi: 10.3748/wjg.v21.i17.5432
Published online May 7, 2015. doi: 10.3748/wjg.v21.i17.5432
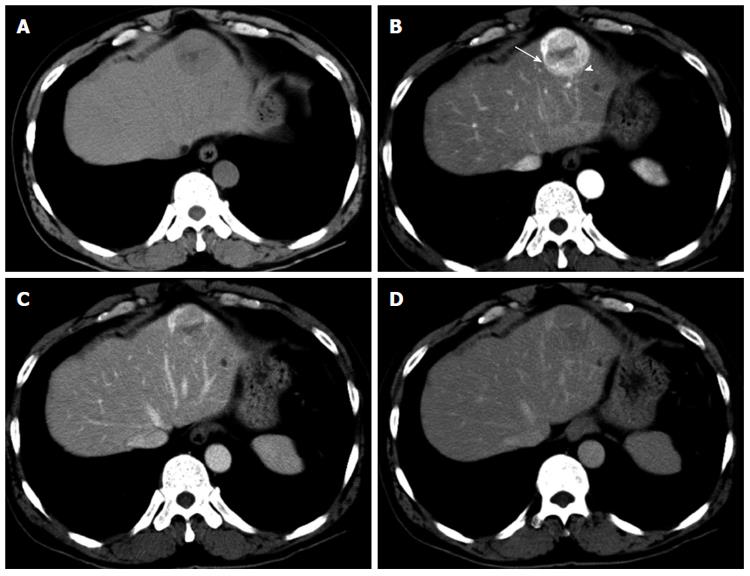
Figure 1 Computed tomography of the liver.
A: The entire mass was visualized as low density on non-contrast computed tomography (CT); B: Contrast-enhanced CT showed a strongly enhanced mass in the arterial phase, and the center of the mass was weakly enhanced; the internal component-like structure showed relatively strong enhancement with a blotchy vascular pattern within the tumor (arrowhead) and distorted vessels (arrow); C and D: The portal (C) and late (D) phase CT scans showed washout of the contrast medium, and a portion of the internal area was weakly enhanced.
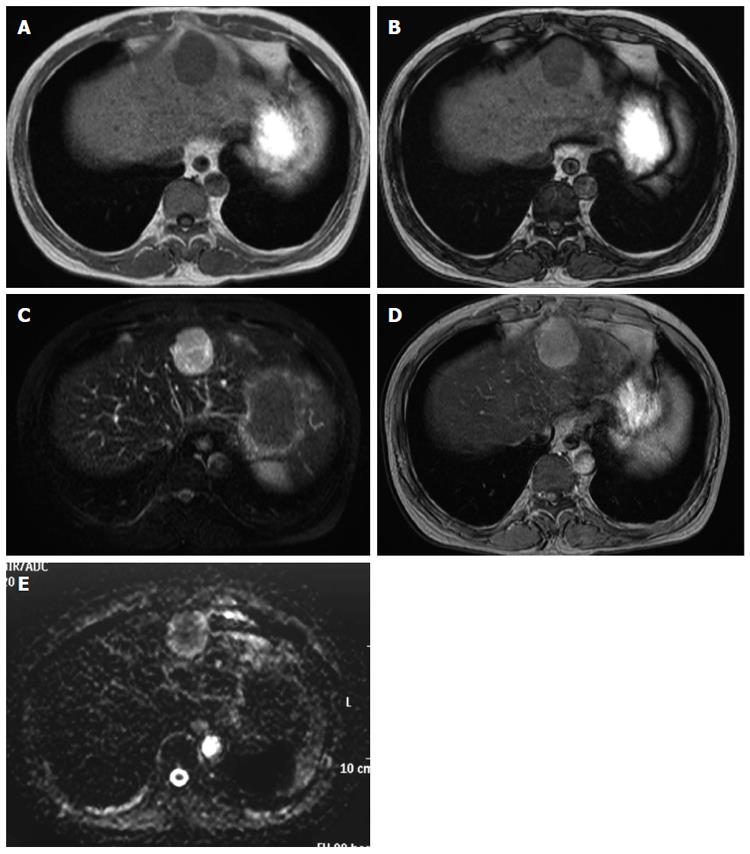
Figure 2 Magnetic resonance imaging of the liver.
A magnetic resonance imaging (MRI) examination was performed on a 1.5 T Achieva Philips device. T1-weighted image (WI): FOV 350, matrix 256 × 204, slice thickness 8 mm, TR 147 ms, TE 2.3/4.6 ms, flip angle 80 degrees; T2-WI: FOV 350, matrix 240 × 196, slice thickness 8 mm, TR 3300 ms, TE 90 ms; T2*-WI: FOV 350, matrix 432 × 346, slice thickness 8 mm, TR 186 ms, TE 8.7 ms, flip angle 60 degrees; Diffusion-WI: FOV 350, matrix 128 × 102, slice thickness 8 mm, TR 1385 ms, TE 70 ms. A: The mass showed ill-defined low signal intensity on the T1-WI; B: There were no decreases in signal intensities in the out-of-phase (B) and in-phase (A) images; C: The mass showed high signal intensity on the T2-WI. The weakly enhanced center of the mass, as shown on computed tomography, was visualized as high signal intensity on the T2-WI, very similar to that observed in the entire mass; D: The mass was also visualized as high signal intensity on the T2*-WI after administration of superparamagnetic iron oxide; E: The mass showed high signal intensity on the diffusion-WI. The apparent diffusion coefficient was 1.491 × 10⁻³ mm2/s.
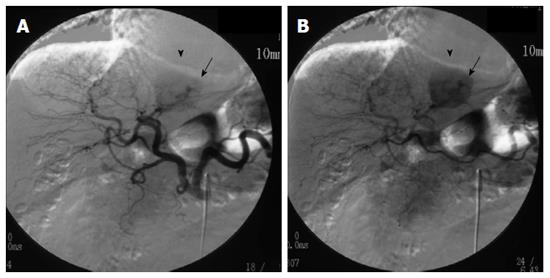
Figure 3 Digital subtraction angiography.
Arteriography of the celiac artery showed strong enhancement (arrowheads) with thickened and distorted vessels (arrows) fed by the left hepatic artery on A and B.
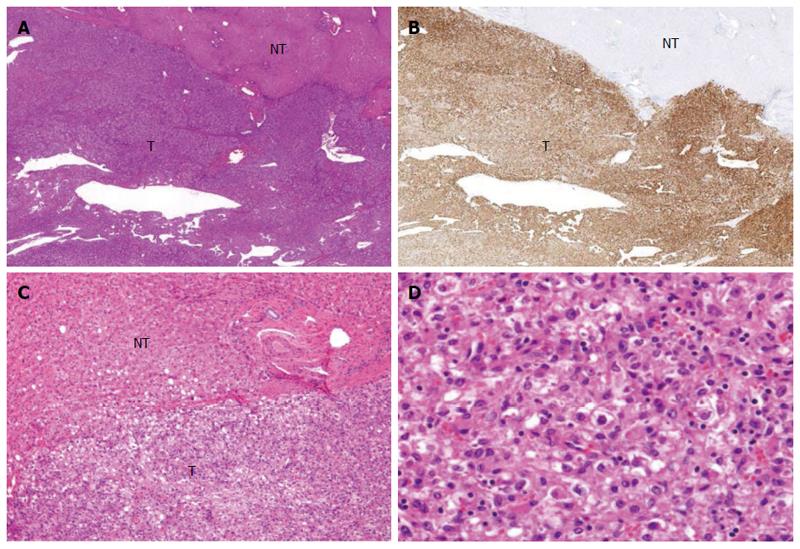
Figure 4 Microscopic features of the operative specimen.
A and C: Show low and high power views, respectively, of the borderline area of the tumor (T) and non-tumor (NT) areas (magnification × 20 and × 200, respectively, hematoxylin eosin staining); B: Shows immunostaining features using an anti-HMB45 antibody (magnification × 20); D: Shows the tumor including fat (magnification × 200; hematoxylin eosin staining).
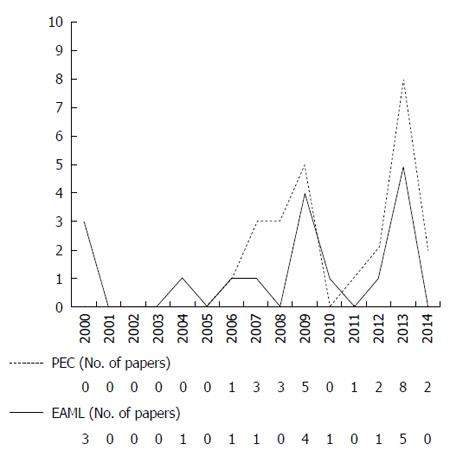
Figure 5 The annual numbers of reported perivascular epithelioid cell tumor and epithelioid angiomyolipoma cases.
PEC: Perivascular epithelioid cell tumor; EAML: Epithelioid angiomyolipoma.
- Citation: Maebayashi T, Abe K, Aizawa T, Sakaguchi M, Ishibashi N, Abe O, Takayama T, Nakayama H, Matsuoka S, Nirei K, Nakamura H, Ogawa M, Sugitani M. Improving recognition of hepatic perivascular epithelioid cell tumor: Case report and literature review. World J Gastroenterol 2015; 21(17): 5432-5441
- URL: https://www.wjgnet.com/1007-9327/full/v21/i17/5432.htm
- DOI: https://dx.doi.org/10.3748/wjg.v21.i17.5432


