Copyright
©The Author(s) 2015.
World J Gastroenterol. May 7, 2015; 21(17): 5271-5280
Published online May 7, 2015. doi: 10.3748/wjg.v21.i17.5271
Published online May 7, 2015. doi: 10.3748/wjg.v21.i17.5271
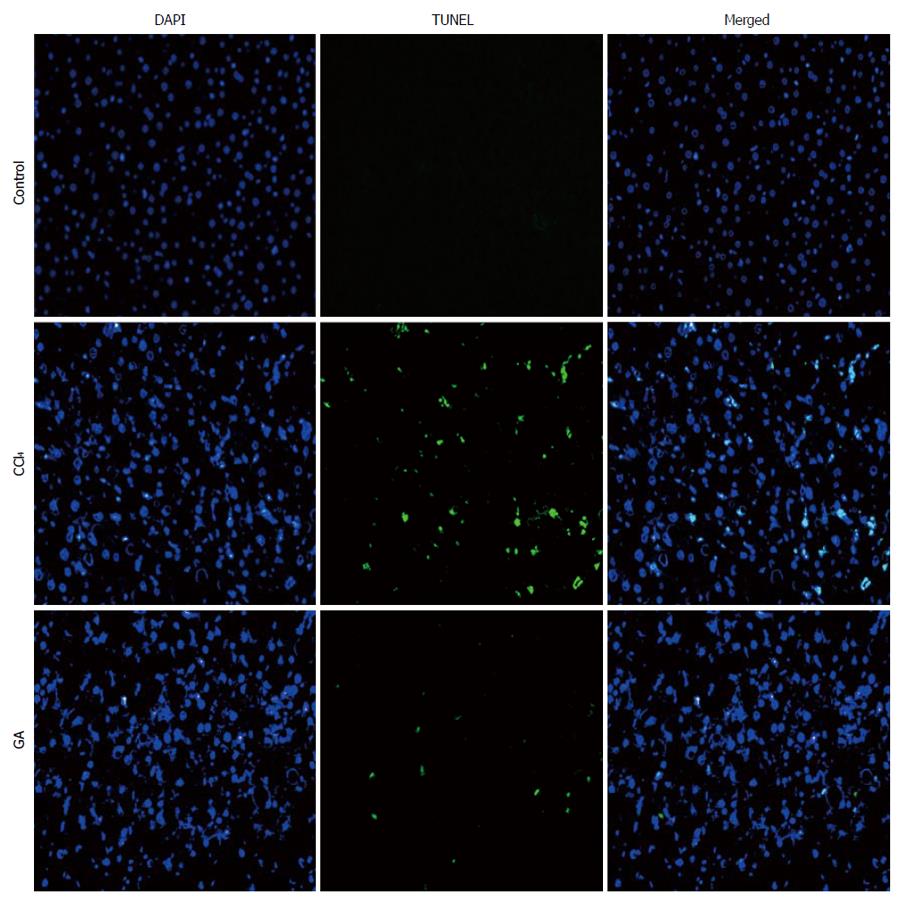
Figure 1 Effects of glycyrrhizic acid on hepatic apoptosis in carbon tetrachloride-induced rat liver fibrosis were detected by TUNEL assay.
Liver tissue sections from different treatment groups were stained with TUNEL (green) and the same sections were respectively counterstained with DAPI to localize the nuclei (blue), and the co-location of green and blue indicated TUNEL-positive cells in the same view (magnification × 200).
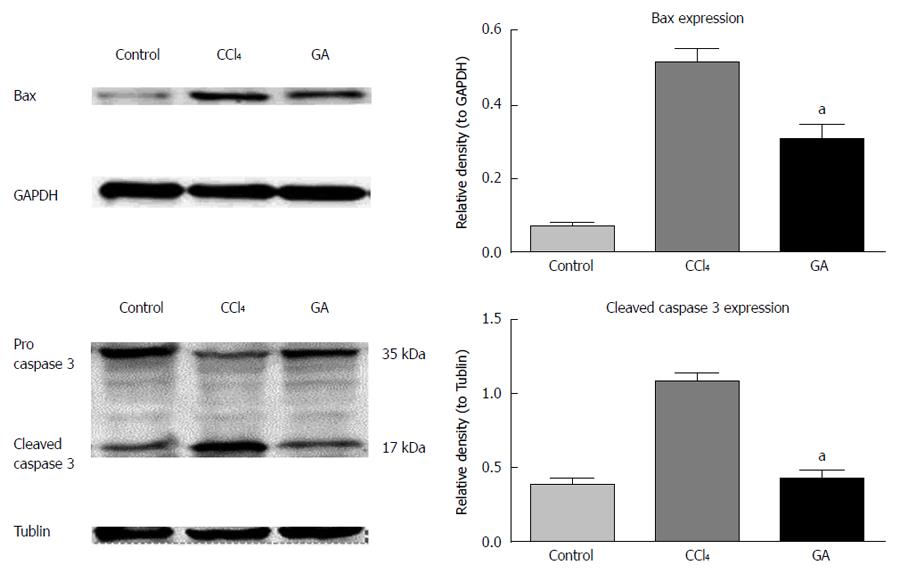
Figure 2 Effects of glycyrrhizic acid on expression of Bax and caspase-3 were evaluated by western blotting.
Total proteins were extracted from the livers of rats in the different treatment groups. GAPDH and tubulin were used to confirm the same sample loading in each lane. Data are shown as mean ± SD. aP < 0.05 vs CCl4 group. GA: Glycyrrhizic acid; CCl4: Carbon tetrachloride.
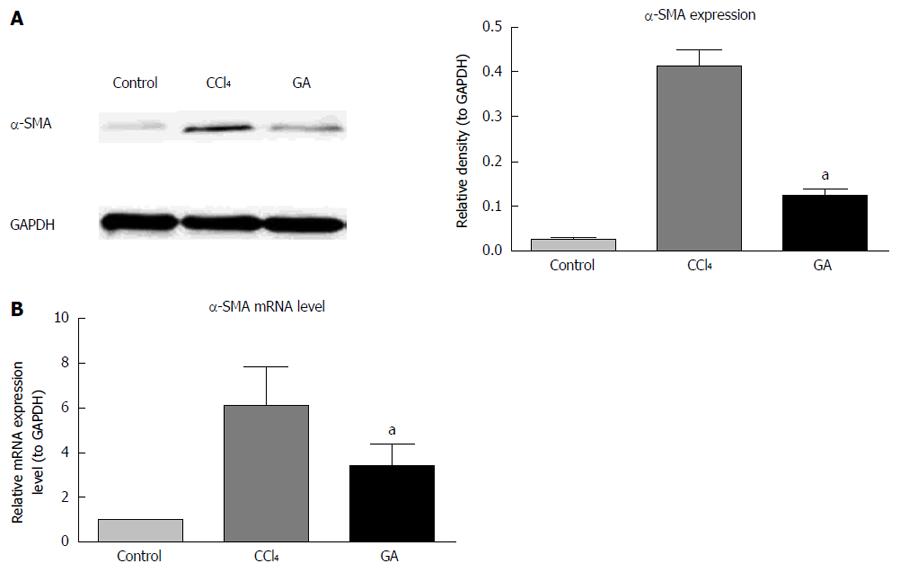
Figure 3 Effects of glycyrrhizic acid on α-SMA expression were estimated by western blotting and real-time polymerase chain reaction.
A: Total proteins were extracted from the livers of rats in the different treatment groups. GAPDH was used to confirm the same sample loading in each lane; B: Total RNA was extracted from the livers of rats in the different treatment groups. GAPDH mRNA was included to normalize the expression of mRNA. Data are shown as mean ± SD. aP < 0.05 vs the CCl4 group.
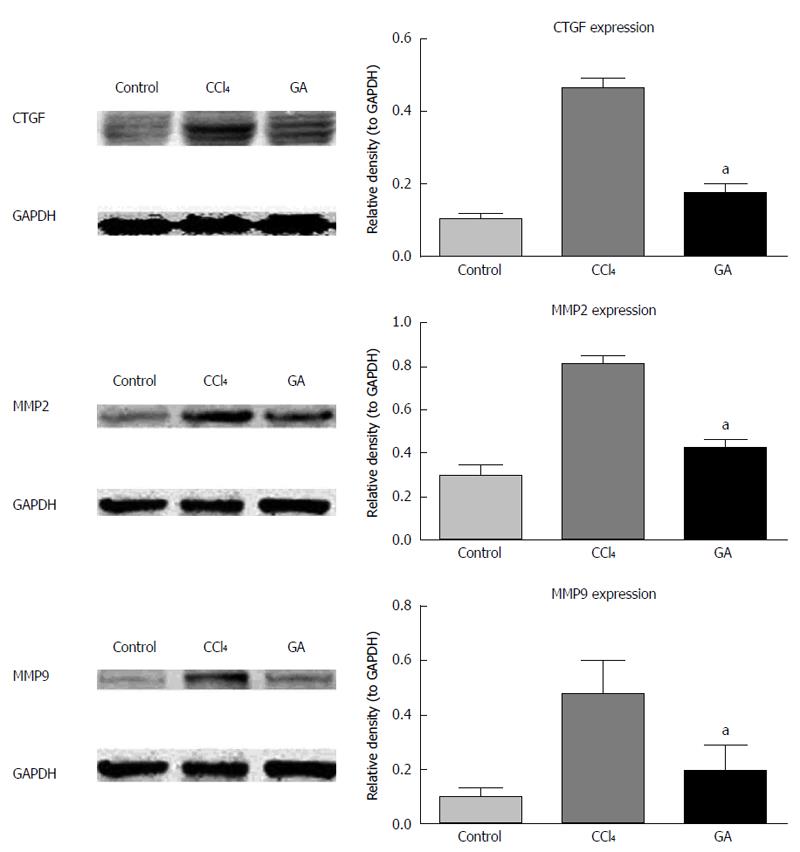
Figure 4 Effects of glycyrrhizic acid on CTGF, MMP2 and MMP9 expression were examined by Western blotting.
Total proteins were extracted from the livers of rats in the different treatment groups. GAPDH was included to confirm the same sample loading in each lane. Data are shown as mean ± SD. aP < 0.05 vs the CCl4 group. GA: Glycyrrhizic acid; CCl4: Carbon tetrachloride.
Figure 5 Effects of glycyrrhizic acid on expression of collagen type I and III mRNA.
Total RNA was extracted from the livers of rats in the different treatment groups. GAPDH mRNA was included to normalize the expression of mRNA. Data are shown as mean ± SD. aP < 0.05 vs the CCl4 group. GA: Glycyrrhizic acid; CCl4: Carbon tetrachloride.
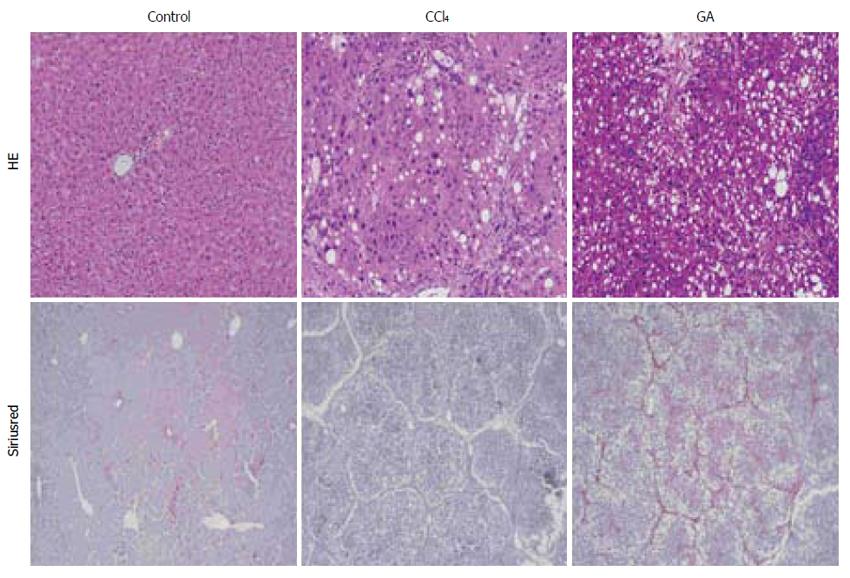
Figure 6 Effects of glycyrrhizic acid on the pathological histology and collagen of livers in carbon tetrachloride-induced rat liver fibrosis were evaluated by hematoxylin-eosin and Sirius red staining.
Liver tissue sections from the different treatment groups were stained with hematoxylin-eosin (magnification × 100) and Sirius red (magnification × 40).
- Citation: Liang B, Guo XL, Jin J, Ma YC, Feng ZQ. Glycyrrhizic acid inhibits apoptosis and fibrosis in carbon-tetrachloride-induced rat liver injury. World J Gastroenterol 2015; 21(17): 5271-5280
- URL: https://www.wjgnet.com/1007-9327/full/v21/i17/5271.htm
- DOI: https://dx.doi.org/10.3748/wjg.v21.i17.5271


