Copyright
©The Author(s) 2015.
World J Gastroenterol. Apr 28, 2015; 21(16): 4961-4968
Published online Apr 28, 2015. doi: 10.3748/wjg.v21.i16.4961
Published online Apr 28, 2015. doi: 10.3748/wjg.v21.i16.4961
Figure 1 Immunophenotypes of the investigated antigens in tumor tissues.
CD15 staining in membrane and perinuclear granules. A: Low CD15 expression, magnification × 100; B: Low CD15 expression, magnification × 400; C: High CD15 expression, magnification × 100; D: High CD15 expression, magnification × 400.
Figure 2 Histogram of the correlation between CD15 expression in tumor tissues and tumor node metastasis staging.
TNM: Tumor node metastasis.
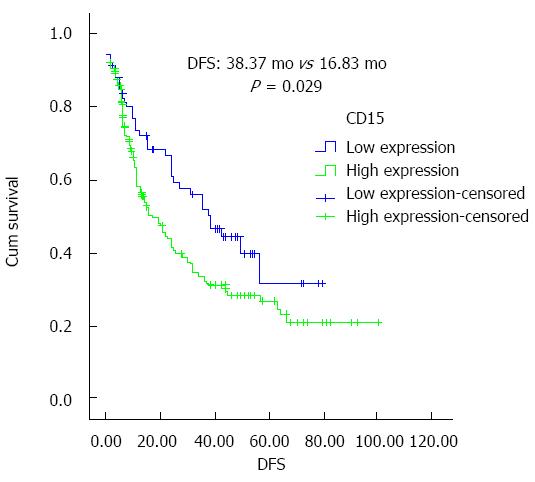
Figure 3 CD15 expression in tumor tissues and disease free survival time.
DFS: Disease free survival time.
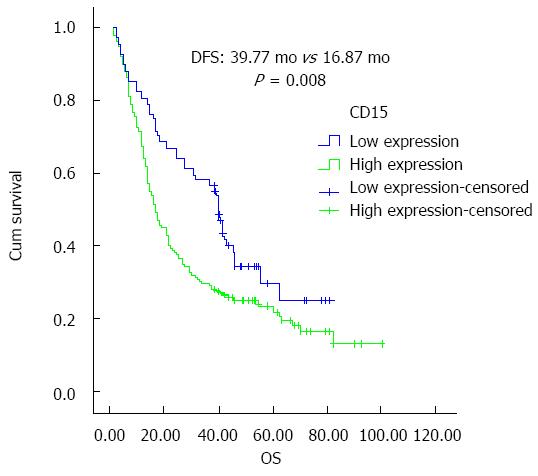
Figure 4 CD15 expression in tumor tissues and overall survival.
OS: overall survival.
- Citation: Mao ZY, Zhu GQ, Xiong M, Ren L, Bai L. Prognostic value of neutrophil distribution in cholangiocarcinoma. World J Gastroenterol 2015; 21(16): 4961-4968
- URL: https://www.wjgnet.com/1007-9327/full/v21/i16/4961.htm
- DOI: https://dx.doi.org/10.3748/wjg.v21.i16.4961


