Copyright
©The Author(s) 2015.
World J Gastroenterol. Apr 21, 2015; 21(15): 4750-4756
Published online Apr 21, 2015. doi: 10.3748/wjg.v21.i15.4750
Published online Apr 21, 2015. doi: 10.3748/wjg.v21.i15.4750
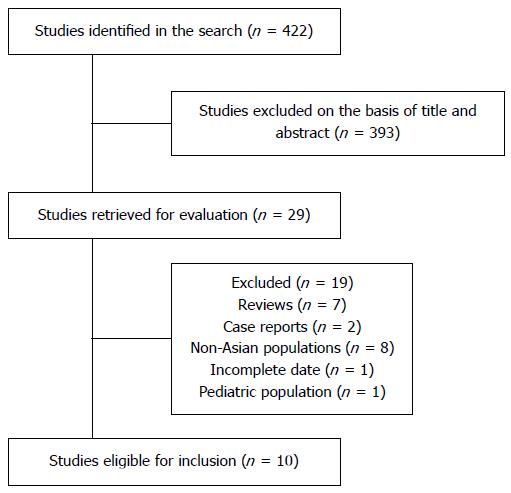
Figure 1 Flow diagram of the study selection process.
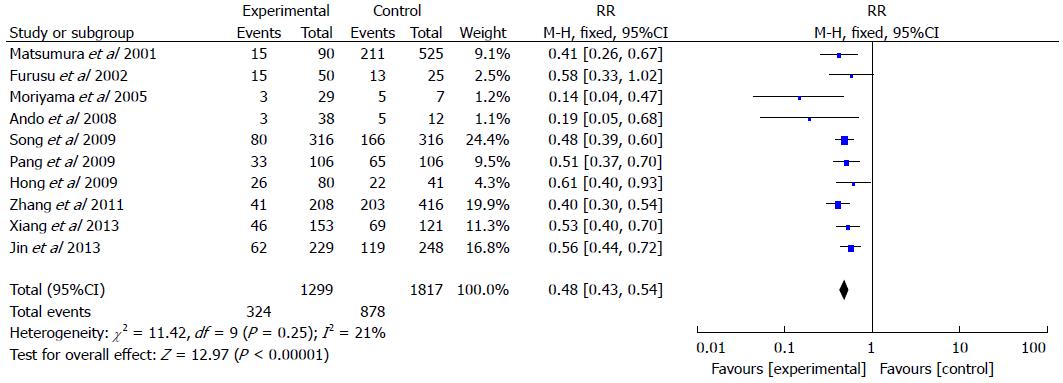
Figure 2 Forest plot of Helicobacter pylori infection rate in inflammatory bowel disease vs control groups.
Figure 3 Forest plot of Helicobacter pylori infection rate in Crohn’s disease vs control groups.
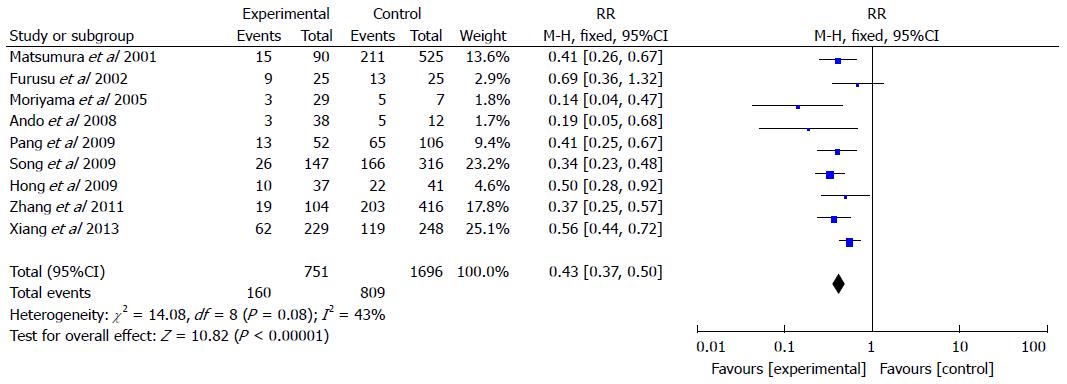
Figure 4 Forest plot of Helicobacter pylori infection rate in ulcerative colitis vs control groups.
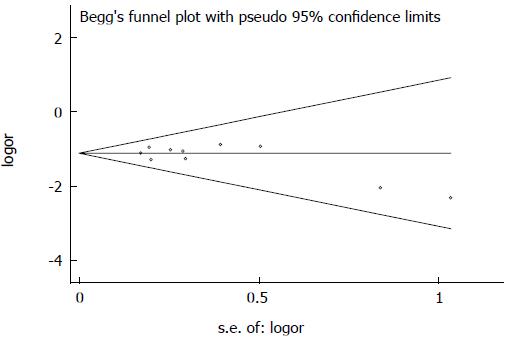
Figure 5 Funnel plot analysis.
-
Citation: Wu XW, Ji HZ, Yang MF, Wu L, Wang FY.
Helicobacter pylori infection and inflammatory bowel disease in Asians: A meta-analysis. World J Gastroenterol 2015; 21(15): 4750-4756 - URL: https://www.wjgnet.com/1007-9327/full/v21/i15/4750.htm
- DOI: https://dx.doi.org/10.3748/wjg.v21.i15.4750


