Copyright
©The Author(s) 2015.
World J Gastroenterol. Apr 21, 2015; 21(15): 4666-4672
Published online Apr 21, 2015. doi: 10.3748/wjg.v21.i15.4666
Published online Apr 21, 2015. doi: 10.3748/wjg.v21.i15.4666
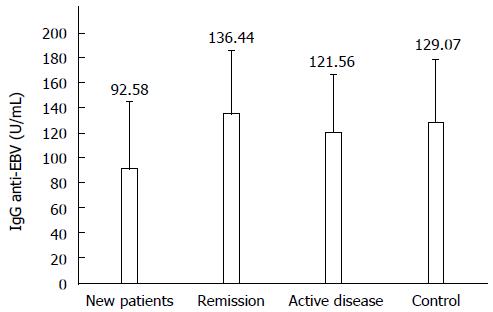
Figure 1 IgG anti-Epstein-Barr virus according to clinical scenarios in Crohn’s disease patients and healthy controls.
New patient (n = 13), remission (n = 13), active disease (n = 10) and control (n = 36). P < 0.05 for new patient vs remission and controls. Values are expressed as mean ± SD.
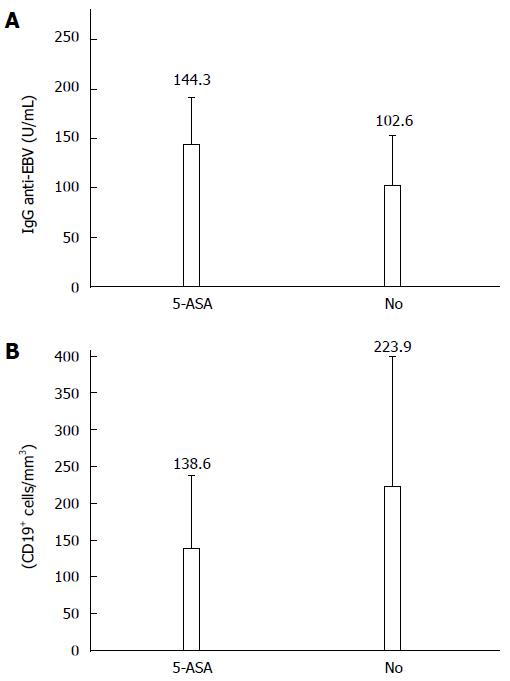
Figure 2 Relationship between anti-Epstein-Barr virus IgG and B cells according to treatment in Crohn’s disease patients.
Patients treated with 5-aminosalicylic acid (5-ASA) were significantly different from untreated patients (No) (Ps < 0.05). Values are expressed as mean ± SD.
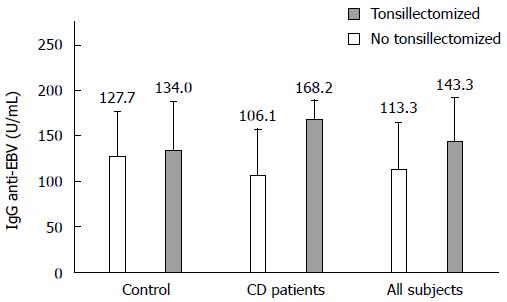
Figure 3 Anti-Epstein-Barr virus IgG according to tonsillectomy in Crohn’s disease patients and controls.
Tonsillectomized patients had significantly higher values; P < 0.05 for CD patients and all subjects. Values are expressed as mean ± SD. EBV: Epstein-Barr virus; CD: Crohn’s disease.
- Citation: Andreu-Ballester JC, Gil-Borrás R, García-Ballesteros C, Catalán-Serra I, Amigo V, Fernández-Fígares V, Cuéllar C. Epstein-Barr virus is related with 5-aminosalicylic acid, tonsillectomy, and CD19+ cells in Crohn’s disease. World J Gastroenterol 2015; 21(15): 4666-4672
- URL: https://www.wjgnet.com/1007-9327/full/v21/i15/4666.htm
- DOI: https://dx.doi.org/10.3748/wjg.v21.i15.4666


