Copyright
©The Author(s) 2015.
World J Gastroenterol. Apr 21, 2015; 21(15): 4564-4573
Published online Apr 21, 2015. doi: 10.3748/wjg.v21.i15.4564
Published online Apr 21, 2015. doi: 10.3748/wjg.v21.i15.4564
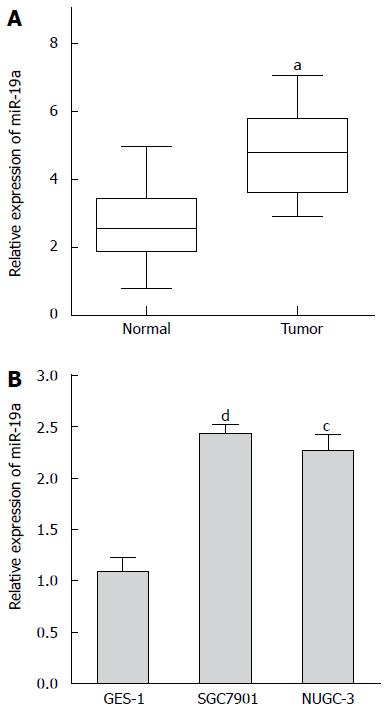
Figure 1 Expression of miR-19a is up-regulated in gastric cancer tissue samples and cell lines.
A: Expression of miR-19a in 50 gastric cancer (GC) tissue samples and matched non-tumor tissue samples is detected by qRT-PCR, aP < 0.05 vs adjacent normal tissues samples; B: Expression of miR-19a in SGC7901, NUGC-3 and GES-1 is detected by qRT-PCR. Values are the average of triple determinations with the SD indicated by error bars, cP < 0.05, dP < 0.01 vs human gastric mucosa cell line.
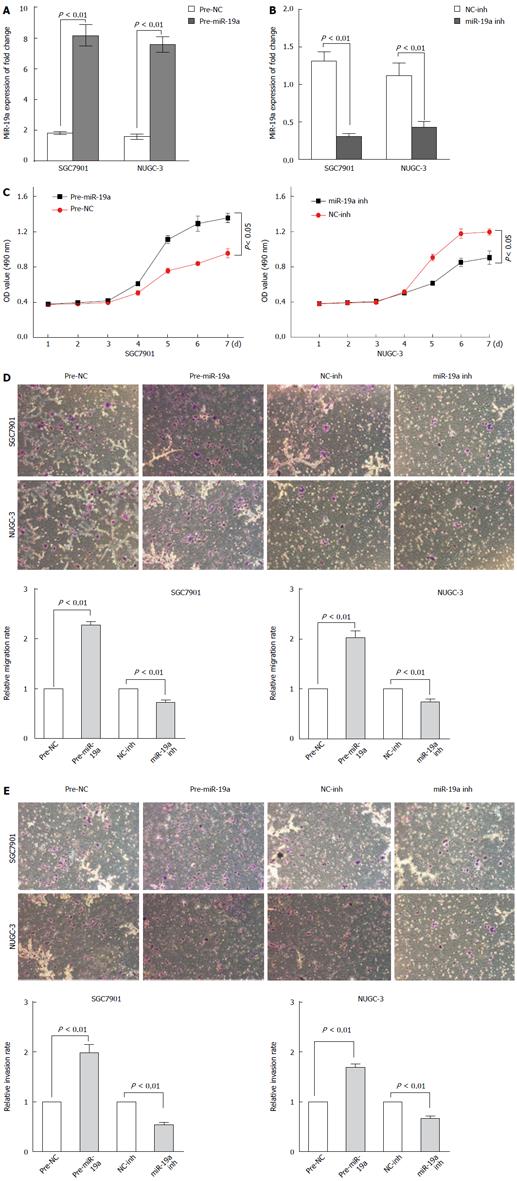
Figure 2 MiR-19a promotes the proliferation of gastric cancer cells and regulates migration and invasion in gastric cancer.
A, B: Expression of miR-19a mRNA in SGC-7901 cells transfected with miR-19a mimic/inhibitor vector (indicated as pre-miR-19a and miR-19a inh) or nagetive control vector (indicated as pre-NC and NC-inh); C: Cell proliferation assay of SGC-7901 cells transfected with miR-19a mimic/inhibitor vector. The OD values are measured each day at the same time point. Data are expressed as mean ± SD from three experiments; D: Representative images of migrated cells on transwell plates that were originally plated with 105 cells. MiR-19a precursors or inhibitors regulate gastric cancer SGC7901 and NUGC-3 cell migration relative to NC group (t-test); E: Representative images showing cells that invaded through transwell and the numbers of invaded cells. MiR-19a precursors or inhibitors regulate gastric cancer SGC7901 and NUGC-3 cell invasion relative to NC group (t test). Each experiment was repeated at least three times. Error bars correspond to the mean ± SD.
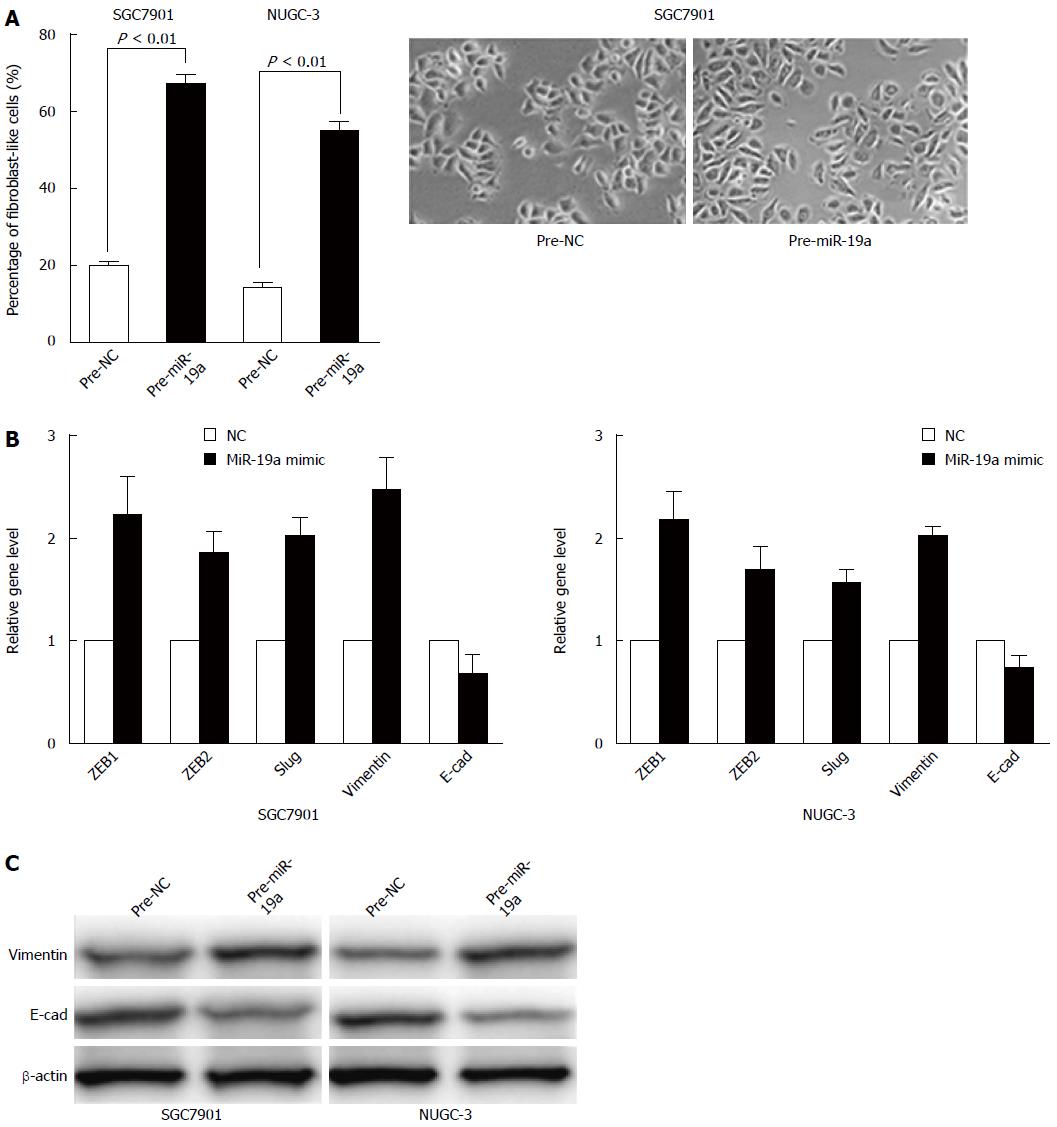
Figure 3 MiR-19a induces an epithelial-mesenchymal transition phenotype.
A: MiR-19a induces an epithelial-mesenchymal transition (EMT) phenotype in SGC7901 and NUGC-3 cells; B: Epithelial and mesenchymal markers ZEB1, ZEB2, Slug, vimentin, and E-cadherin are measured by qRT-PCR in miR-19a mimic or negative control (NC)-transfected SGC7901 and NUGC-3 cells. The results are shown as fold change compared with negative control. Data are the means ± SD of three independent experiments; C: The E-cadherin and vimentin protein levels are measured using Western blot analysis. β-actin protein serve as an internal (loading) control.
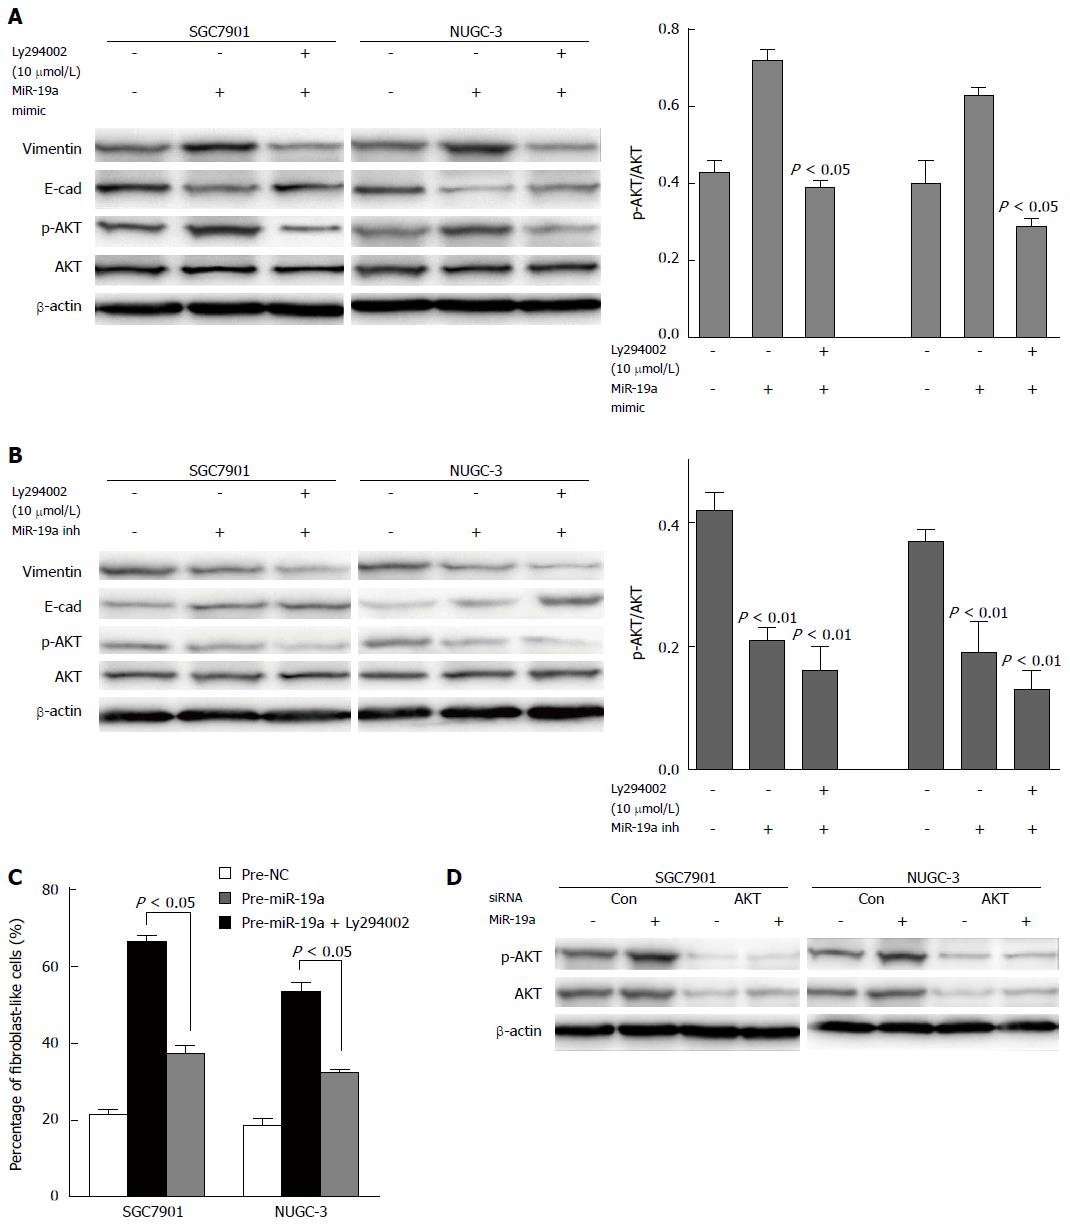
Figure 4 MiR-19a promotes epithelial-mesenchymal transition by activating the PI3K/AKT pathway.
A, B: Expression profiles of p-AKT, AKT, epithelial and mesenchymal markers E-cadherin and vimentin, and β-actin in SGC-7901 and NUGC-3 cells of each group are detected by Western blot analysis. To SGC-7901 and NUGC-3 cells cultures, the PI3K/AKT pathway inhibitor Ly294002 is added, with a final concentration of 10 μmol/L. Normal control groups and groups transfected with miR-19a mimic/inhibitor are established for both SGC-7901 and NUGC-3; C: EMT phenotype in SGC7901 and NUGC-3 cells treated with miR-19a mimic in the presence of Ly294002 (10 μmol/L). The data are expressed as the mean ± SD of three independent experiments; D: Western blots showing AKT and p-AKT expression levels in cells cotransfected with miR-19a mimic and AKT siRNA.
- Citation: Lu WD, Zuo Y, Xu Z, Zhang M. MiR-19a promotes epithelial-mesenchymal transition through PI3K/AKT pathway in gastric cancer. World J Gastroenterol 2015; 21(15): 4564-4573
- URL: https://www.wjgnet.com/1007-9327/full/v21/i15/4564.htm
- DOI: https://dx.doi.org/10.3748/wjg.v21.i15.4564


