Copyright
©The Author(s) 2015.
World J Gastroenterol. Apr 7, 2015; 21(13): 3983-3993
Published online Apr 7, 2015. doi: 10.3748/wjg.v21.i13.3983
Published online Apr 7, 2015. doi: 10.3748/wjg.v21.i13.3983
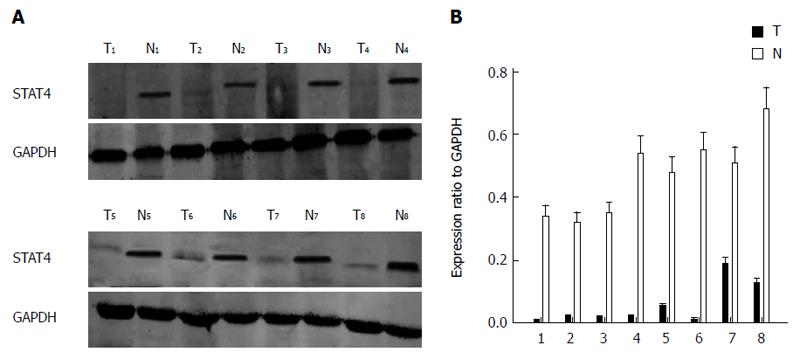
Figure 1 Expression of signal transducer and activator of transcription 4 in human hepatocellular carcinoma tissues.
A, B: Expression of STAT4 in eight representative matched samples of HCC tissue (T) and adjacent noncancerous liver tissues (N) via Western blot and SigmaPlot. STAT4: Signal transducer and activator of transcription 4; HCC: Hepatocellular carcinoma.
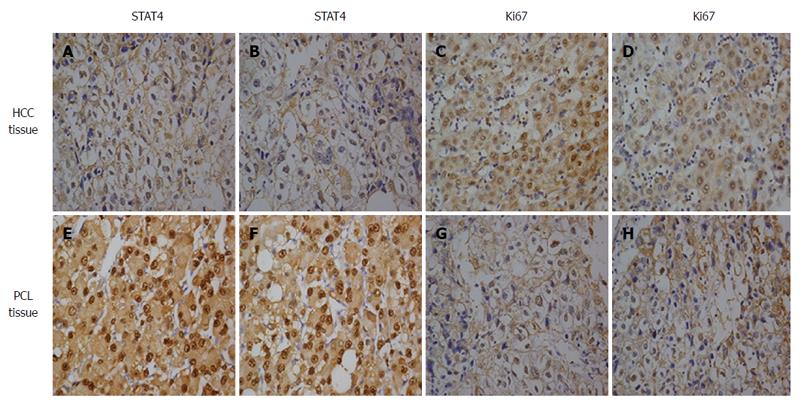
Figure 2 Immunohistochemical analysis of signal transducer and activator of transcription 4 and Ki67 expression in hepatocellular carcinoma and adjacent noncancerous liver tissues.
Paraffin-embedded tissue sections were stained with antibodies against STAT4 and Ki67 and counterstained with hematoxylin. High expression of STAT4 (E, F) and Ki67 (C, D) was detected in the HCC tissues. Low expression of STAT4 (A, B) and high expression of Ki67 (G, H) were detected in adjacent noncancerous liver tissues (SP × 400) based on immunohistochemistry. STAT4: Signal transducer and activator of transcription 4; HCC: Hepatocellular carcinoma.
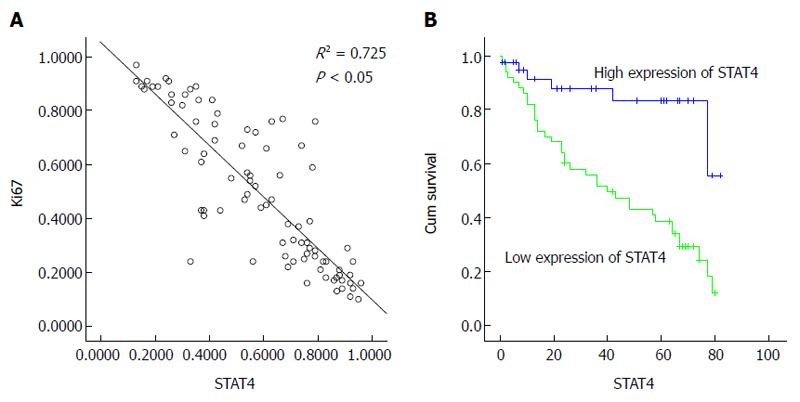
Figure 3 Relationship between signal transducer and activator of transcription 4 expression and the Ki67 proliferation index in hepatocellular carcinoma.
A: Scatterplot of STAT4 expression vs Ki-67 expression; the regression line indicates a correlation based on the Spearman correlation coefficient; B: Kaplan-Meier survival curves of 90 HCC patients stratified into low and high STAT4 expression show a highly significant difference between these groups (P < 0.05, log-rank test using SPSS). STAT4: Signal transducer and activator of transcription 4; HCC: Hepatocellular carcinoma.
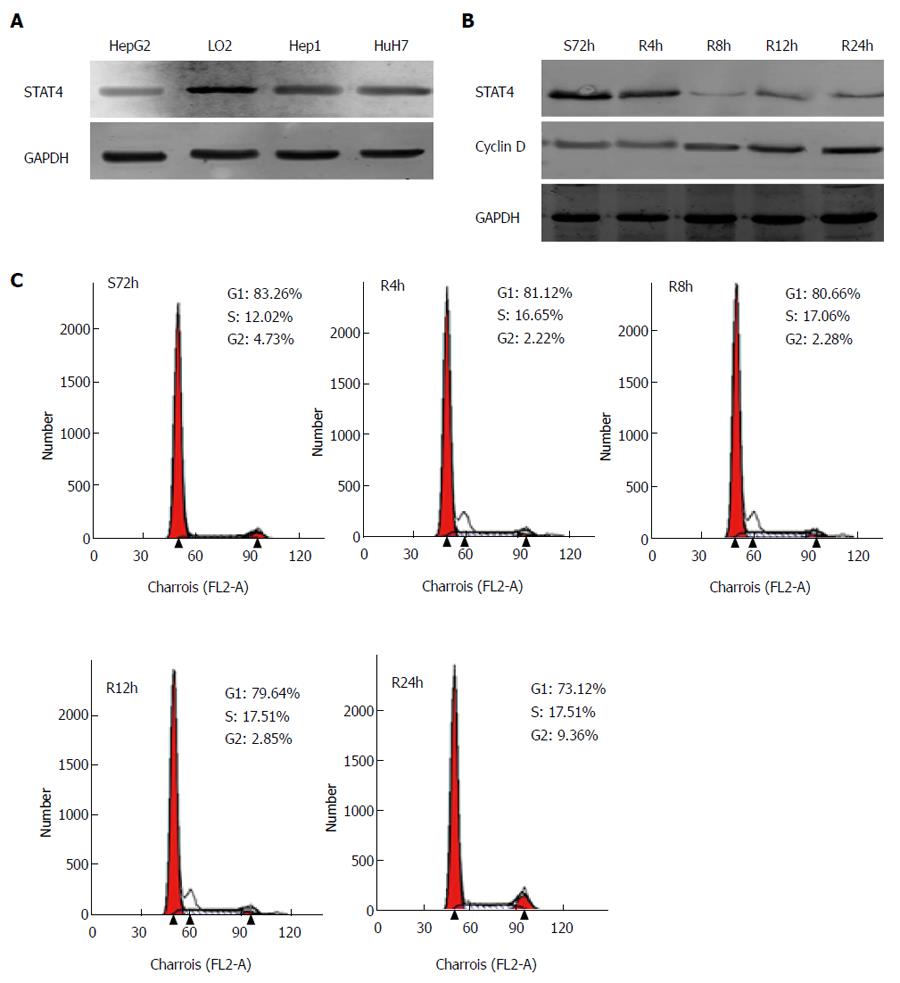
Figure 4 Western blot analysis of signal transducer and activator of transcription 4 protein expression in hepatocellular carcinoma cells compared to normal hepatocyte (L02) cells.
A: GAPDH was used as a loading control. Each experiment was repeated at least 3 times; B: Expression of STAT4 and cell cycle-related molecules in proliferating HCC cells. HepG2 cells were synchronized via serum starvation for 72 h. Upon serum refeeding, cell lysates were prepared and analyzed via Western blot using antibodies directed against STAT4 and cyclin D1. GAPDH was used as a control for protein load and integrity. S: Serum starvation; R: Serum refeeding; C: Flow cytometric quantification of the cell cycle status in HepG2 cells. The cells were synchronized at G1 via serum starvation for 72 h; then, progression into the cell cycle was induced by adding medium containing 10% FBS for the indicated period (R4 h, R8 h, R12 h, or R24 h). STAT4: Signal transducer and activator of transcription 4; HCC: Hepatocellular carcinoma.
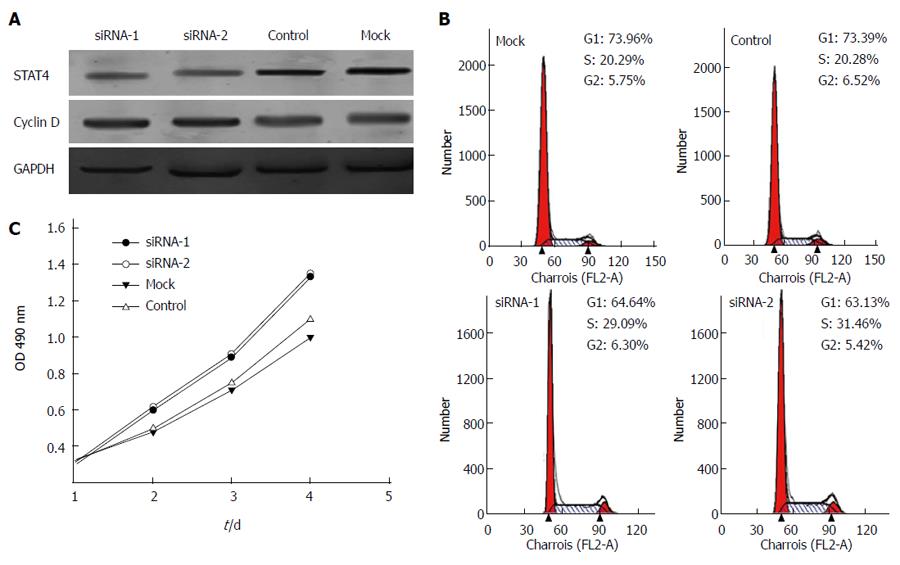
Figure 5 Signal transducer and activator of transcription 4 knockdown inhibited cell proliferation and the effects of altered signal transducer and activator of transcription 4 expression on the cell cycle status of L02 cells.
A: Western blot analysis revealed that treatment with STAT4-siRNA markedly decreased the STAT4 and cyclin D1 levels at 48 h after siRNA transfection in L02 cells compared to transfection with negative control siRNA and mock transfection; B: siSTAT4-1 and -2 were used to knockdown STAT4 in HepG2 cells, resulting in the delay of the G1-S transition and significant arrest in the G1 phase after these cells were released from starvation. The data are presented as the mean ± SD of three experiments; C: A CCK-8 assay showed that STAT4 knockdown inhibited cell proliferation. CCK-8 reagents were added to the medium for 2 h. The absorbance was measured at each indicated time point (0, 1, 2, and 3 d). Each value was derived from three independent experiments. STAT4: Signal transducer and activator of transcription 4; HCC: Hepatocellular carcinoma.
- Citation: Wang G, Chen JH, Qiang Y, Wang DZ, Chen Z. Decreased STAT4 indicates poor prognosis and enhanced cell proliferation in hepatocellular carcinoma. World J Gastroenterol 2015; 21(13): 3983-3993
- URL: https://www.wjgnet.com/1007-9327/full/v21/i13/3983.htm
- DOI: https://dx.doi.org/10.3748/wjg.v21.i13.3983


