Copyright
©The Author(s) 2015.
World J Gastroenterol. Mar 14, 2015; 21(10): 3100-3108
Published online Mar 14, 2015. doi: 10.3748/wjg.v21.i10.3100
Published online Mar 14, 2015. doi: 10.3748/wjg.v21.i10.3100
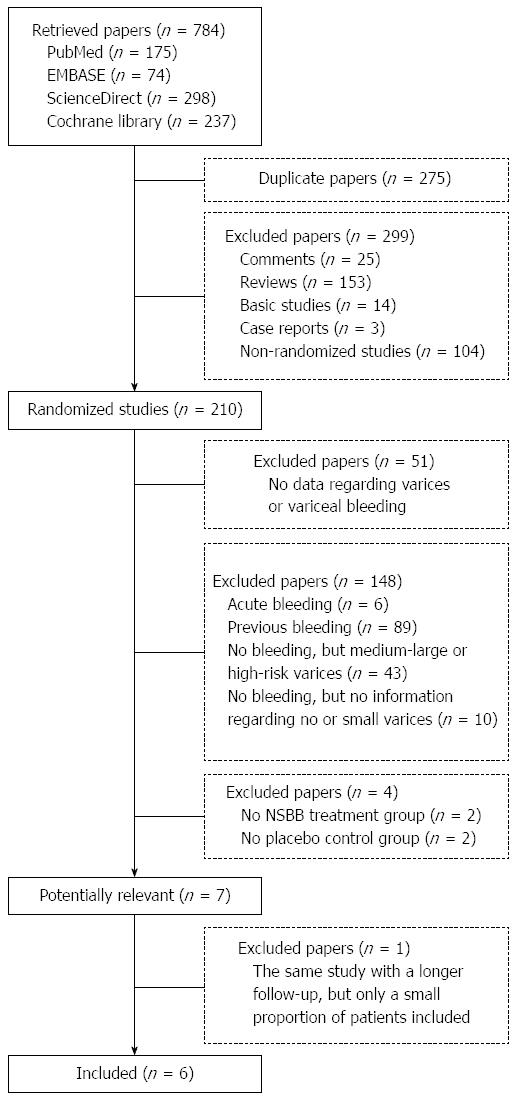
Figure 1 Flowchart of study selection.
Figure 2 Forest plots comparing the development of large varices between nonselective beta-blockers and placebo groups.
Figure 3 Forest plots comparing first upper-gastrointestinal bleeding between nonselective beta-blockers and placebo groups.
Figure 4 Forest plots comparing the rate of death between nonselective beta-blockers and placebo groups.
Figure 5 Forest plots comparing the rate of adverse events between nonselective beta-blockers and placebo groups.
- Citation: Qi XS, Bao YX, Bai M, Xu WD, Dai JN, Guo XZ. Nonselective beta-blockers in cirrhotic patients with no or small varices: A meta-analysis. World J Gastroenterol 2015; 21(10): 3100-3108
- URL: https://www.wjgnet.com/1007-9327/full/v21/i10/3100.htm
- DOI: https://dx.doi.org/10.3748/wjg.v21.i10.3100


