Copyright
©The Author(s) 2015.
World J Gastroenterol. Jan 7, 2015; 21(1): 214-220
Published online Jan 7, 2015. doi: 10.3748/wjg.v21.i1.214
Published online Jan 7, 2015. doi: 10.3748/wjg.v21.i1.214
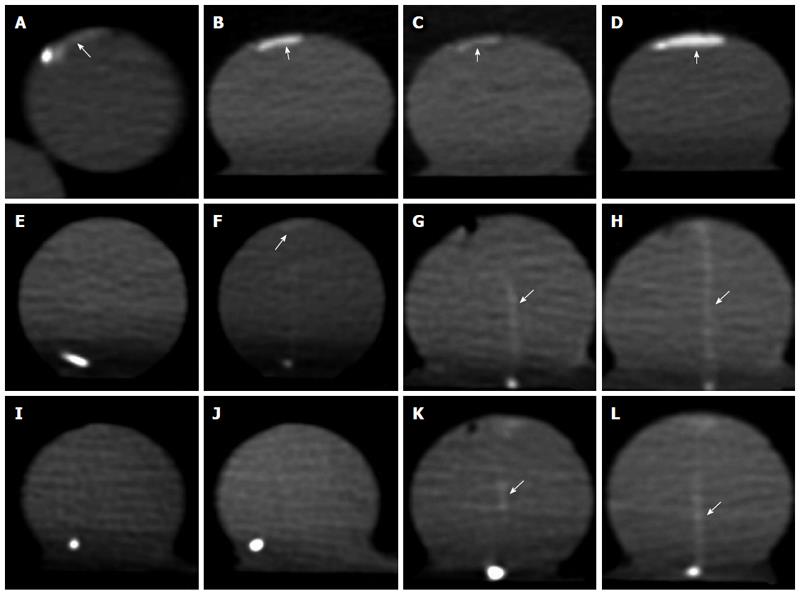
Figure 1 Computed tomography scan.
A: Image of 64-slice computed tomography (CT) scan at 0.5 mL/min in the arterial phase (arrow) (AP); B, C: Monochromatic energy images at 60 and 100 keV in the AP at 0.5 mL/min, which are clearer than the polychromatic energy images (arrow) (A); D: Monochromatic energy image at 60 keV in the portal venous phase (arrow) (PVP) at 0.5 mL/min, which is more clear than that in the AP (B); E, F: Images at 64-slice CT scan in the AP and (arrow) PVP at 0.05 mL/min. No region of exudation could be observed in the AP, but it was observed vaguely in the PVP; G, H: Images at 50 keV monochromatic energy in the AP and PVP (arrow) at 0.05 mL/min, which are much clearer than those obtained by 64-slice CT scan (E, F); I, J: Images at 64-slice CT scan in the AP and PVP at 0.025 mL/min,on which no exudation region could be detected; K, L: Monochromatic energy images at 50 keV in the AP and PVP (arrow) at 0.025 mL/min, on which the exudation regions can be clearly seen.
- Citation: Liu WD, Wu XW, Hu JM, Wang B, Liu B. Monochromatic energy computed tomography image for active intestinal hemorrhage: A model investigation. World J Gastroenterol 2015; 21(1): 214-220
- URL: https://www.wjgnet.com/1007-9327/full/v21/i1/214.htm
- DOI: https://dx.doi.org/10.3748/wjg.v21.i1.214


