Copyright
©The Author(s) 2015.
World J Gastroenterol. Jan 7, 2015; 21(1): 196-213
Published online Jan 7, 2015. doi: 10.3748/wjg.v21.i1.196
Published online Jan 7, 2015. doi: 10.3748/wjg.v21.i1.196
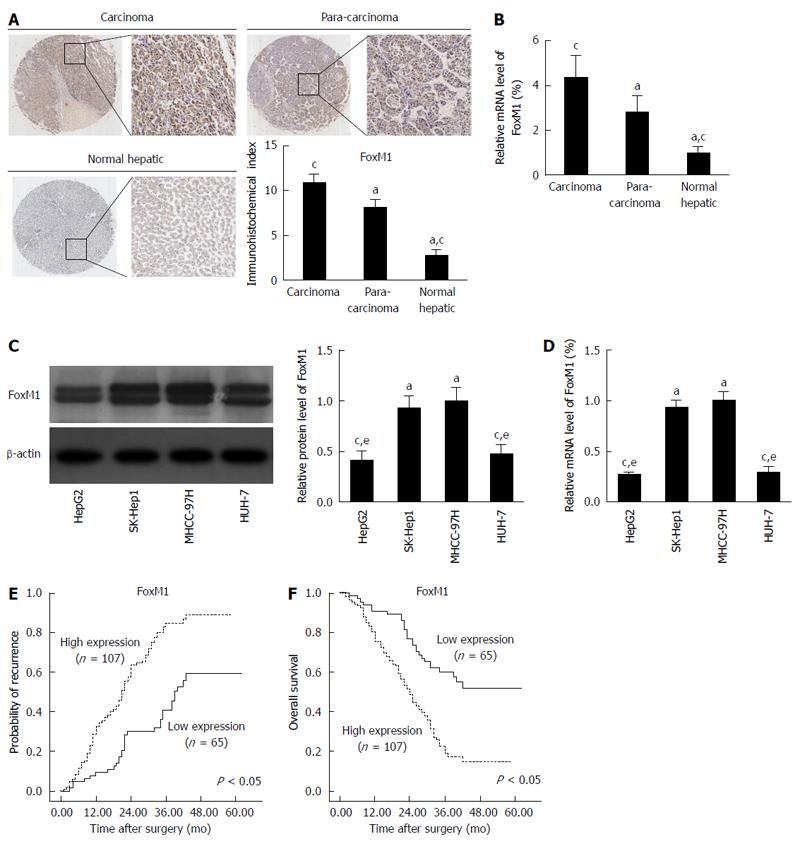
Figure 1 Forkhead box protein M1 overexpression correlates significantly with hepatocellular carcinoma metastasis.
A: Immunohistochemistry was used to detect forkhead box protein M1 (FoxM1) expression in normal liver, para-carcinoma, and carcinoma (HCC) tissues (aP < 0.05 vs carcinoma; cP < 0.05 vs para-carcinoma); B: Quantitative real-time polymerase chain reaction (qRT-PCR) analysis of FoxM1 mRNA expression in normal liver, para-carcinoma, and carcinoma (HCC) tissues (aP < 0.05 vs carcinoma; cP < 0.05 vs para-carcinoma). Glyceraldehyde-3-phospate dehydrogenase (GAPDH) mRNA was used for normalization; C: Western blot analysis of FoxM1 expression in human HCC cell lines (aP < 0.05 vs HepG2; cP < 0.05 vs SK-Hep1; eP < 0.05 vs MHCC-97H); D: qRT-PCR analysis of FoxM1 mRNA expression in human HCC cell lines (aP < 0.05 vs HepG2; cP < 0.05 vs SK-Hep1; eP < 0.05 vs MHCC-97H). GAPDH mRNA was used for normalization; E and F: Kaplan-Meier analysis of the correlation between FoxM1 expression level and recurrence or overall survival of HCC patients.
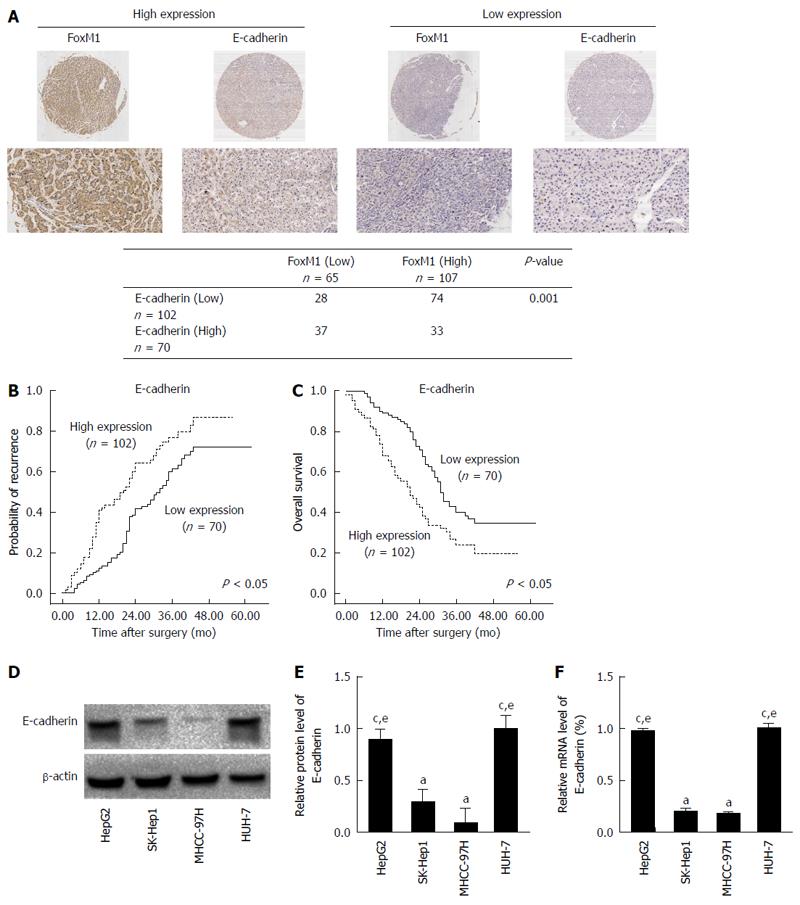
Figure 2 Forkhead box protein M1 overexpression negatively correlates with E-cadherin expression in hepatocellular carcinoma.
A: Forkhead box protein M1 (FoxM1) expression was negatively correlated with E-cadherin expression in hepatocellular carcinoma (HCC) tissues. Representative immunohistochemical images are shown (P < 0.05); B and C: Kaplan-Meier analysis of the correlation between E-cadherin expression and the recurrence or overall survival of HCC patients (P < 0.05); D: Western blot analysis of E-cadherin expression in human HCC cell lines (aP < 0.05 vs HepG2; cP < 0.05 vs SK-Hep1; eP < 0.05 vs MHCC-97H); E: Quantitative real-time polymerase chain reaction analysis of E-cadherin mRNA expression in human HCC cell lines (aP < 0.05 vs HepG2; cP < 0.05 vs SK-Hep1; eP < 0.05 vs MHCC-97H). Glyceraldehyde-3-phospate dehydrogenase mRNA was used for normalization.
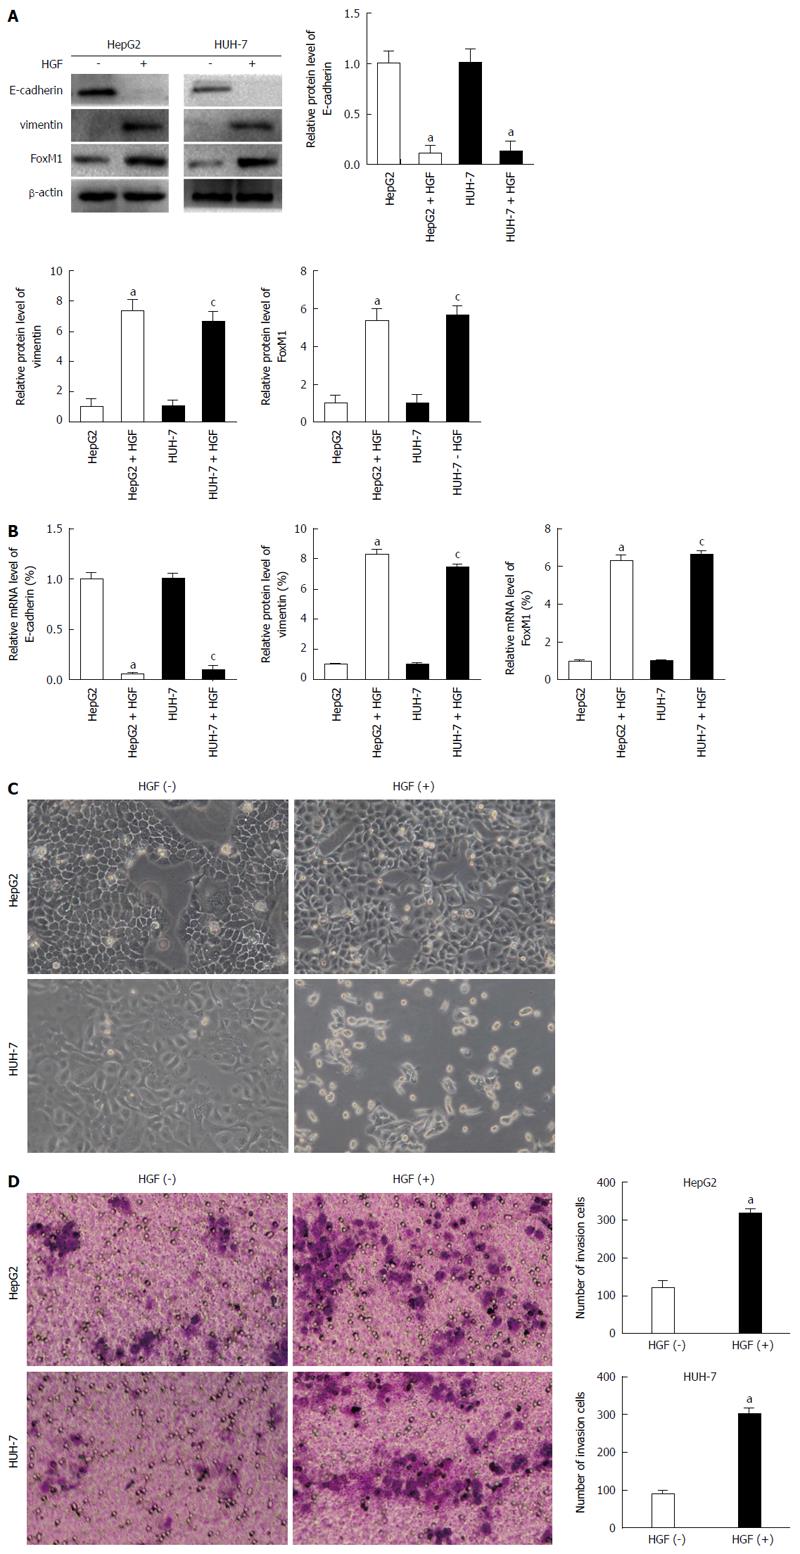
Figure 3 Hepatocyte growth factor up-regulates the expression of forkhead box protein M1, and induces epithelial-mesenchymal transition.
A and B: HepG2 and HUH-7 (low metastatic potential) cells were treated with phosphate-buffered saline (PBS) or hepatocyte growth factor (HGF) for 48 h. The protein and mRNA levels of forkhead box protein M1 (FoxM1), E-cadherin and vimentin were measured by Western blot and quantitative real-time polymerase chain reaction. A densitometric analysis was performed, and the protein/mRNA levels of FoxM1, E-cadherin and vimentin in negative control cells were set to 100% (aP < 0.05 vs HepG2 control; cP < 0.05 vs HUH-7 control). Glyceraldehyde-3-phospate dehydrogenase mRNA was used for normalization; C: HepG2 and HUH-7 cells were treated with PBS or HGF for 48 h, and the typical morphology changes was measured using a light microscope; D: HepG2 and HUH-7 cells were treated with PBS or HGF for 48 h, and the invasion changes was measured by Transwell assay (aP < 0.05 vs control).
Figure 4 Forkhead box protein M1 is required for epithelial-mesenchymal transition.
A and B: HepG2 and HUH-7 cells were transfected with 1 ug/mL of pcDNA3.1 or pcDNA3.1-forkhead box protein M1 (FoxM1) for 48 h. The protein/mRNA levels of FoxM1, E-cadherin and vimentin were measured by Western blot and quantitative real-time polymerase chain reaction (qRT-PCR). A densitometric analysis was performed, and the protein/mRNA levels of FoxM1, E-cadherin and vimentin in pcDNA3.1 cells were set to 100% (aP < 0.05 vs HepG2 pcDNA3.1; cP < 0.05 vs HUH-7 pcDNA3.1). Glyceraldehyd-3-phospate dehydrogenase (GAPDH) mRNA was used for normalization; C: HepG2 and HUH-7 cells were transfected with pcDNA3.1 or pcDNA3.1-FoxM1 for 48 h, and the typical morphology changes were measured using a light microscope; D: HepG2 and HUH-7 cells were transfected with pcDNA3.1 or pcDNA3.1-FoxM1 for 48 h, and the invasion changes was measured by Transwell assay (aP < 0.05 vs pcDNA3.1); E: The HepG2 and Huh7 cells were transfected with 100 nmol/L of each siRNA for 48 h. The protein/mRNA levels of FoxM1 were measured by Western blot and qRT-PCR. A densitometric analysis was performed, and the protein/mRNA levels of FoxM1 in control-siRNA cells were set to 100% (aP < 0.05 vs control-siRNA; cP < 0.05 vs FoxM1-siRNA-1). GAPDH mRNA was used for normalization. Mixed siRNA was used in subsequent experiments; F and G: HepG2 and HUH-7 cells were transfected with FoxM1-siRNA or control-siRNA in the presence of HGF for 48 h, and the protein/mRNA levels of FoxM1, E-cadherin and vimentin were measured by Western blot and qRT-PCR. A densitometric analysis was performed, and the protein/mRNA levels of FoxM1, E-cadherin and vimentin in control-siRNA cells were set to 100% (aP < 0.05 vs HepG2 control-siRNA; cP < 0.05 vs HUH-7 control-siRNA). GAPDH mRNA was used for normalization; H: HepG2 and HUH-7 cells were transfected with FoxM1-siRNA or control-siRNA in the presence of hepatocyte growth factor (HGF) for 48 h, and the invasion changes was measured by Transwell assay (aP < 0.05 vs control-siRNA).
Figure 5 Snail homolog 1 is required to induce the forkhead box protein M1-mediated epithelial-mesenchymal transition in hepatocellular carcinoma cells.
A: Aberrant overexpression of forkhead box protein M1 (FoxM1) in HepG2 and HUH-7 cells increased mRNA levels of epithelial-mesenchymal transition (EMT) genes as demonstrated by quantitative real-time polymerase chain reaction (qRT-PCR) (aP < 0.05 vs pcDNA3.1). Glyceraldehyd-3-phospate dehydrogenase (GAPDH) mRNA was used for normalization; B: Foxm1 directly binds to the snail homolog 1 (SNAI1) promoter region after hepatocyte growth factor (HGF) treatment. HepG2 cells were incubated with HGF for 24 h and protein/DNA complexes were immunoprecipitated using antibodies specific for Foxm1. Foxm1 binding was normalized to DNA samples immunoprecipitated with isotype control antibodies [aP < 0.05 FoxM1 IP-no hepatocyte growth factor (HGF) vs IgG IP-no HGF; cP < 0.05 FoxM1 IP + HGF vs IgG IP + HGF; eP < 0.05 FoxM1 IP + HGF vs FoxM1 IP-no HGF]; C: In HepG2 cells, transcriptional activity of the -720 bp SNAI1 promoter was increased by pcDNA3.1-FoxM1 transfection, but not by HGF alone (aP < 0.05 vs pcDNA3.1-no HGF; cP < 0.05 vs pcDNA3.1 + HGF); D: The HepG2 and Huh7 cells were transfected with 100 nmol/L of each siRNA for 48 h. The protein/mRNA levels of SNAI1 were measured by Western blot and qRT-PCR. A densitometric analysis was performed, and the protein/mRNA levels of SNAI1 in control-siRNA cells were set to 100% (aP < 0.05 vs control-siRNA; cP < 0.05 vs SNAI1-siRNA-1). GAPDH mRNA was used for normalization. Mixed siRNA was used in subsequent experiments; E and F: HepG2 and HUH-7 cells were transfected with SNAI1-siRNA or control-siRNA in the presence of pcDNA3.1-FoxM1 for 48 h, and the protein/mRNA levels of FoxM1, SNAI1, E-cadherin and vimentin were measured by Western blot and qRT-PCR. A densitometric analysis was performed, and the protein/mRNA levels of FoxM1, SNAI1, E-cadherin and vimentin in control-siRNA cells were set to 100% (aP < 0.05 vs HepG2 control-siRNA; cP < 0.05 vs HUH-7 control-siRNA). GAPDH mRNA was used for normalization; G: HepG2 and HUH-7 cells were transfected with SNAI1-siRNA or control-siRNA in the presence of pcDNA3.1-FoxM1 for 48 h, and the typical morphology changes was measured using a light microscope; H: HepG2 and HUH-7 cells were transfected with SNAI1-siRNA or control-siRNA in the presence of pcDNA3.1-FoxM1 for 48 h, and the invasion changes was measured by Transwell assay (aP < 0.05 vs control-siRNA).
- Citation: Meng FD, Wei JC, Qu K, Wang ZX, Wu QF, Tai MH, Liu HC, Zhang RY, Liu C. FoxM1 overexpression promotes epithelial-mesenchymal transition and metastasis of hepatocellular carcinoma. World J Gastroenterol 2015; 21(1): 196-213
- URL: https://www.wjgnet.com/1007-9327/full/v21/i1/196.htm
- DOI: https://dx.doi.org/10.3748/wjg.v21.i1.196


