Copyright
©The Author(s) 2015.
World J Gastroenterol. Jan 7, 2015; 21(1): 155-163
Published online Jan 7, 2015. doi: 10.3748/wjg.v21.i1.155
Published online Jan 7, 2015. doi: 10.3748/wjg.v21.i1.155
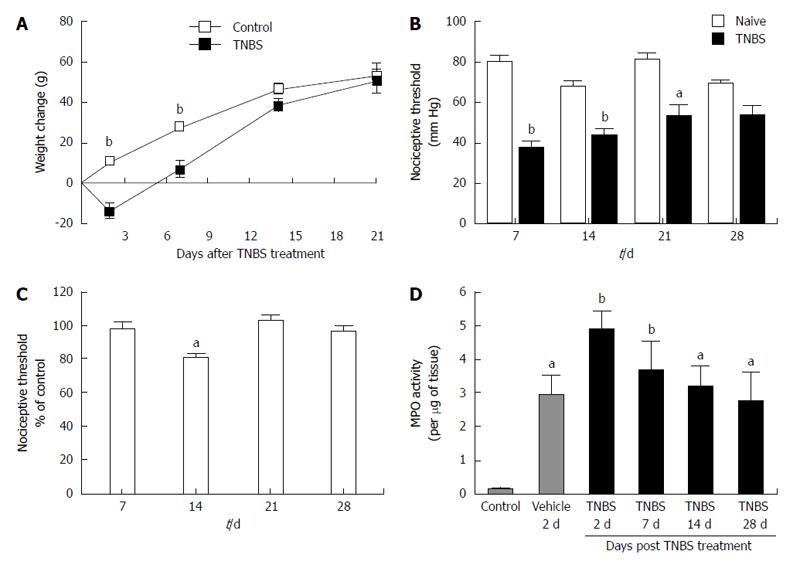
Figure 1 Colitis induction following trinitrobenzene sulfonic acid administration.
A: Weight loss after trinitrobenzene sulfonic acid (TNBS) enema. Graph shows the weight change in grams after TNBS treatment (n = 20 for control, n = 20 for Day 0, n = 20 for Day 2, n = 20 for Day 7, n = 12 for Day 14, n = 5 for Day 21); B: Visceral hypersensitivity after TNBS treatment. Graph representing colo-rectal distension (CRD) scores in mmHg before and after TNBS (n = 10 for 7 d, n = 15 for 14 d, n = 5 for 21 d, n = 8 for 28 d); C: somatic hypersensitivity after TNBS treatment. Graph representing the mechanical threshold testing on the hind paws, Von Frey. Data were shown as a percentage of control (naïve) threshold response (n = 21 for 7 d, n = 24 for 14 d, n = 12 for 21 d, n = 27 for 28 d); D: presence of inflammation following TNBS-induced colitis. Graph shows the average myeloperoxidase (MPO) activity (vehicle = ethanol, for all conditions, n = 3, each with 8 replicates). aP < 0.05, bP < 0.01 vs controls; ANOVA with Bonferroni’s and Dunnett’s posttests.
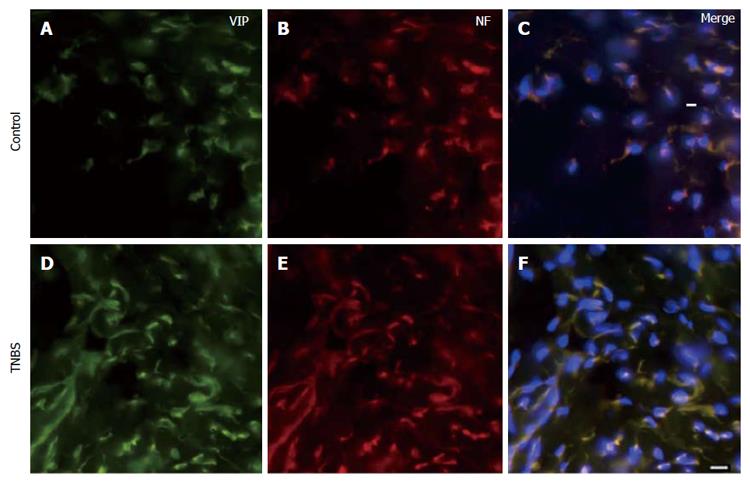
Figure 2 Vasoactive intestinal peptide co-localizes with the neuronal marker; Neurofilament.
Vasoactive intestinal peptide (VIP) co-localizes with the neuronal marker; Neurofilament (NF). Top panel shows VIP positive cells (A), NF positive cells (B) and co-labeled cells in yellow with DAPI nuclear stain in blue (C) for control animals. Lower panel shows VIP positive cells (D), NF positive cells (E) and co-labeled cells in yellow with DAPI nuclear stain in blue (F) 14 d following TNBS treatment. TNBS: Trinitrobenzene sulfonic acid.
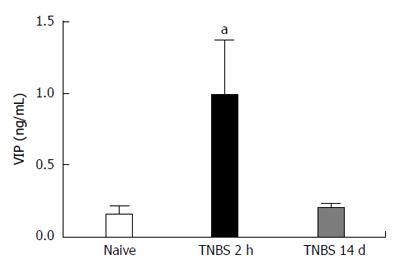
Figure 3 Vasoactive intestinal peptide in plasma after trinitrobenzene sulfonic acid treatment.
Plasma concentration of vasoactive intestinal peptide (VIP) was assessed in naïve animals and after trinitrobenzene sulfonic acid (TNBS) treatment at the 2-h and 14-d time-points using a peptide enzyme immunoassay. n = 4 for all conditions, aP < 0.05 vs controls; ANOVA with Dunnett’s posttests.
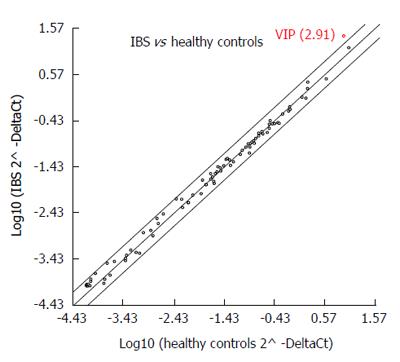
Figure 4 Gene expression in irritable bowel syndrome participants vs healthy controls.
Compares the expression of 88 genes and PCR controls for IBS participants (n = 12) vs healthy participants (n = 12). VIP fold regulation = 2.91. Boundary = 2. IBS: Irritable bowel syndrome; VIP: Vasoactive intestinal peptides.
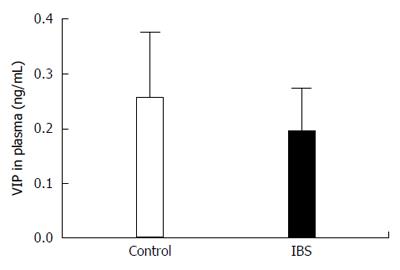
Figure 5 Vasoactive intestinal peptide in human plasma.
Vasoactive intestinal peptide (VIP) protein levels were not significantly different in IBS patients (n = 12, 0.193 ng/mL) when compared to controls (n = 11, 0.254 ng/mL), P = 0.173. IBS: Irritable bowel syndrome.
- Citation: Del Valle-Pinero AY, Sherwin LB, Anderson EM, Caudle RM, Henderson WA. Altered vasoactive intestinal peptides expression in irritable bowel syndrome patients and rats with trinitrobenzene sulfonic acid-induced colitis. World J Gastroenterol 2015; 21(1): 155-163
- URL: https://www.wjgnet.com/1007-9327/full/v21/i1/155.htm
- DOI: https://dx.doi.org/10.3748/wjg.v21.i1.155


