Copyright
©2014 Baishideng Publishing Group Co.
World J Gastroenterol. Mar 7, 2014; 20(9): 2412-2419
Published online Mar 7, 2014. doi: 10.3748/wjg.v20.i9.2412
Published online Mar 7, 2014. doi: 10.3748/wjg.v20.i9.2412
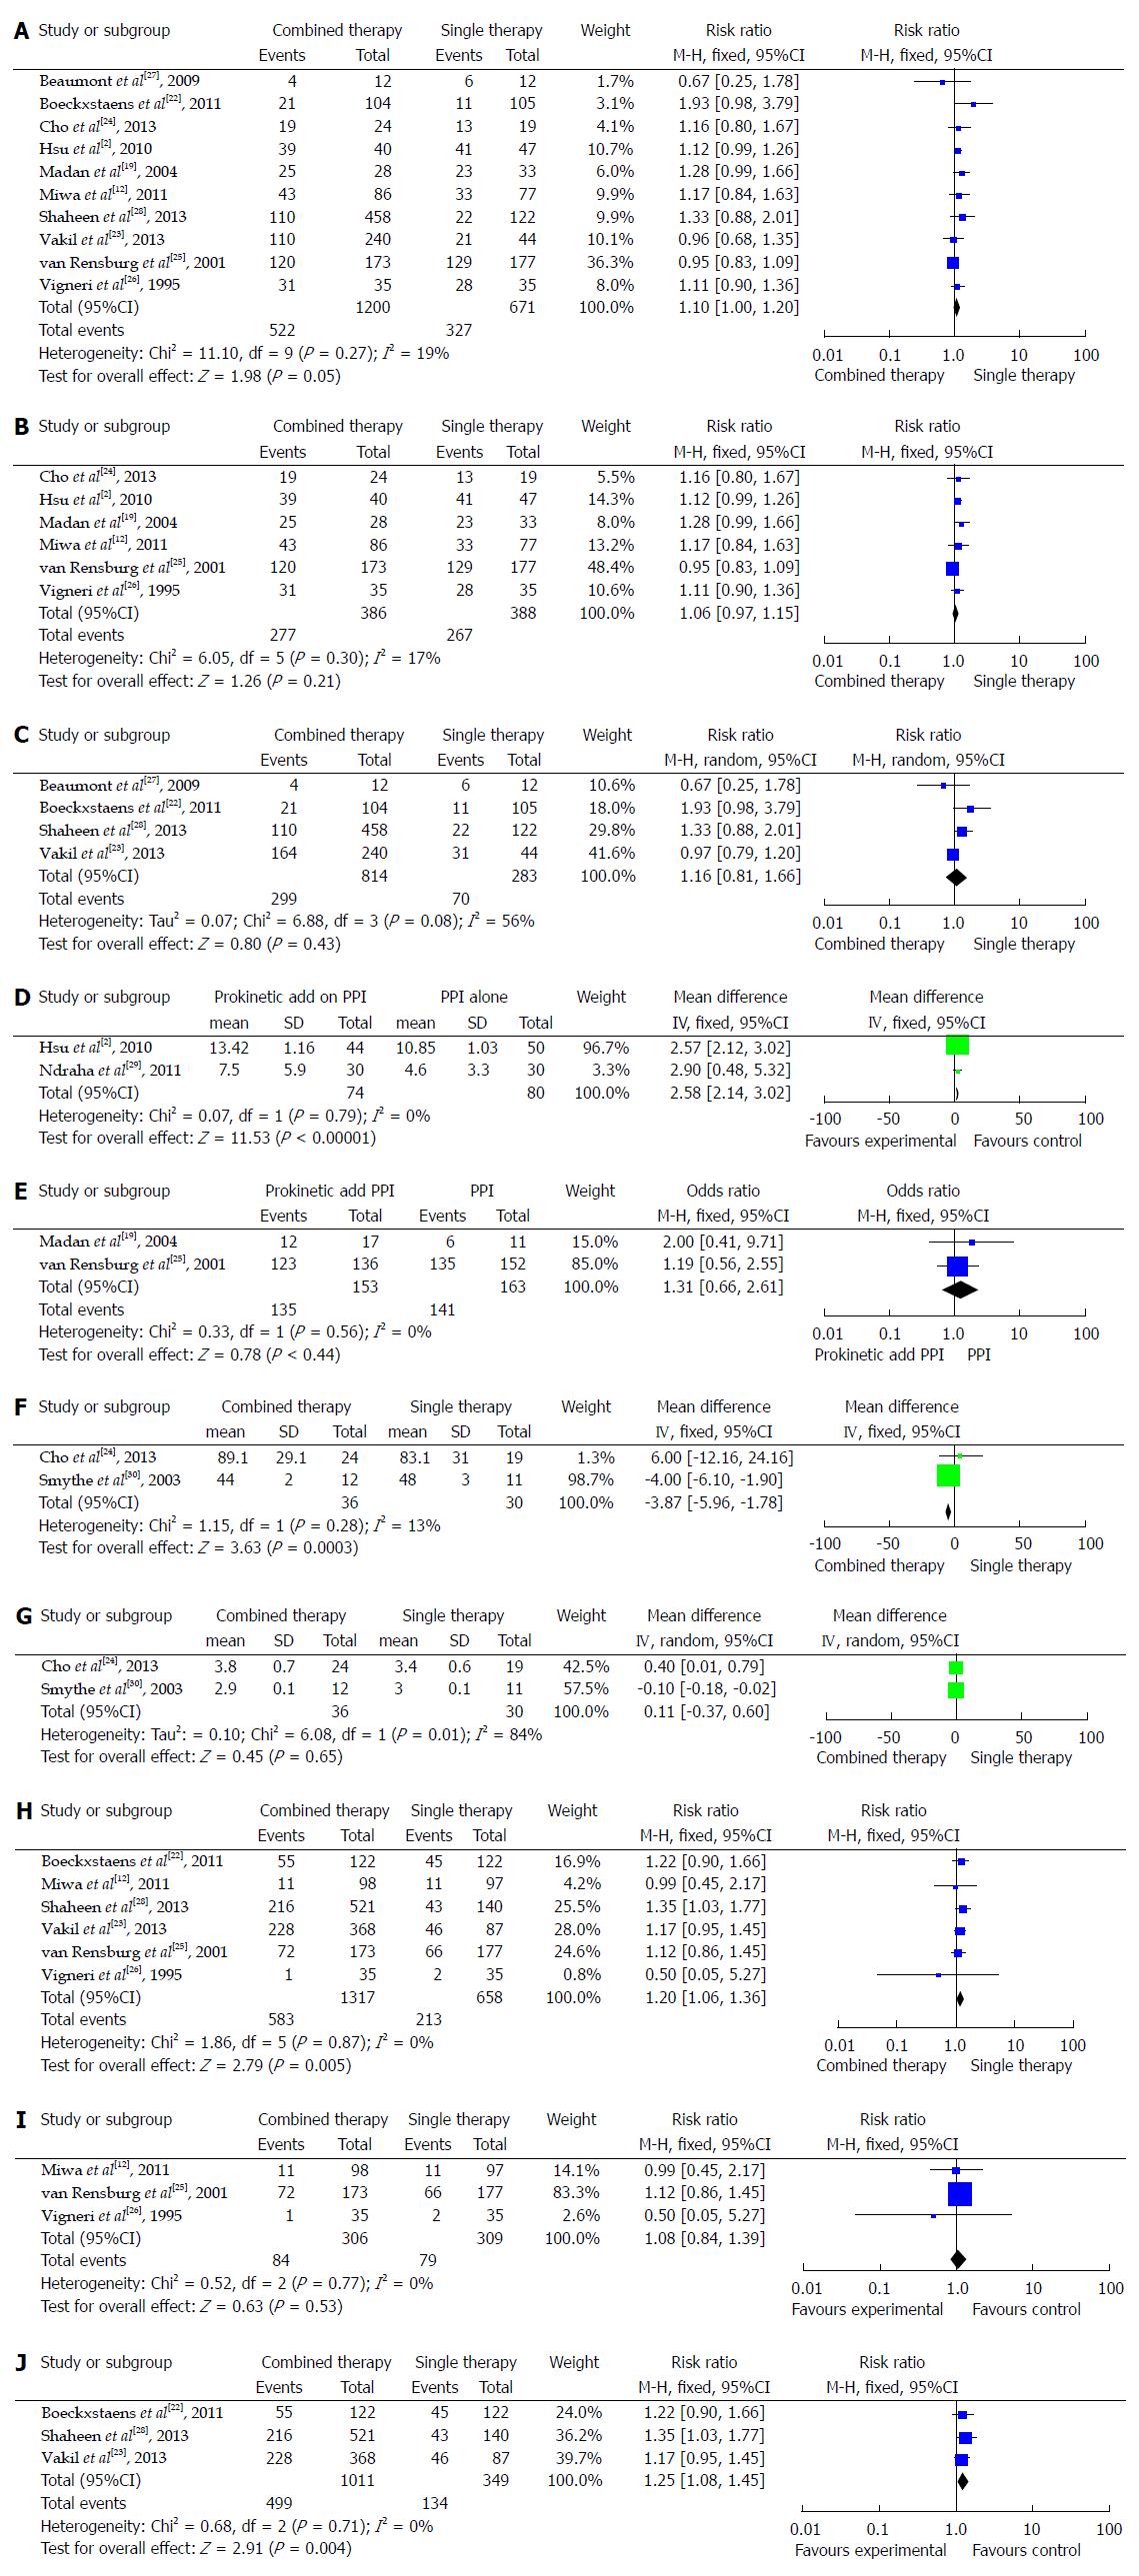
Figure 1 Meta-analysis.
A: Symptom response in 5-hydroxytryptamine (5-HT) and GABA-B receptor therapies; B: Symptom response in the 5-HT receptor agonist group; C: Symptom response in the GABA-B receptor agonist group; D: Symptom score change (FSSG) in the two therapies; E: Endoscopic response in 5-HT and GABA-B receptor therapies; F: Wave amplitude in 5-HT and GABA-B receptor therapies; G: Wave duration in 5-HT and GABA-B receptor therapies; H: Adverse events proportion in 5-HT and GABA-B therapies; I: Adverse events in 5-HT agonist group; J: Adverse events in GABA-B receptor agonist group.
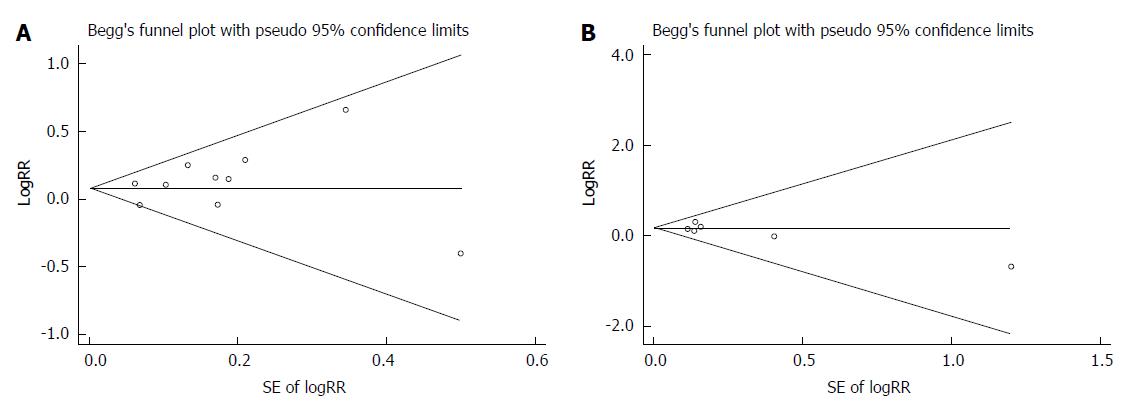
Figure 2 Funnel plots for publication bias in meta-analysis.
A: No publication bias was detected in symptom response (Egger’s test P = 0.333; Begg’s test P = 0.721); B: Adverse event proportion (Egger’s test P = 0.246; Begg’s test P = 0.452).
- Citation: Ren LH, Chen WX, Qian LJ, Li S, Gu M, Shi RH. Addition of prokinetics to PPI therapy in gastroesophageal reflux disease: A meta-analysis. World J Gastroenterol 2014; 20(9): 2412-2419
- URL: https://www.wjgnet.com/1007-9327/full/v20/i9/2412.htm
- DOI: https://dx.doi.org/10.3748/wjg.v20.i9.2412


