Copyright
©2014 Baishideng Publishing Group Co.
World J Gastroenterol. Mar 7, 2014; 20(9): 2365-2373
Published online Mar 7, 2014. doi: 10.3748/wjg.v20.i9.2365
Published online Mar 7, 2014. doi: 10.3748/wjg.v20.i9.2365
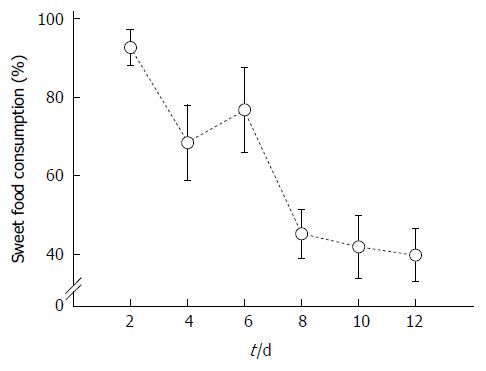
Figure 1 Time-dependent changes of sweet food consumption in normal rats for 12 d.
The percentage of sweet food consumption decreased to below 50% 8 d after sweet food feeding.
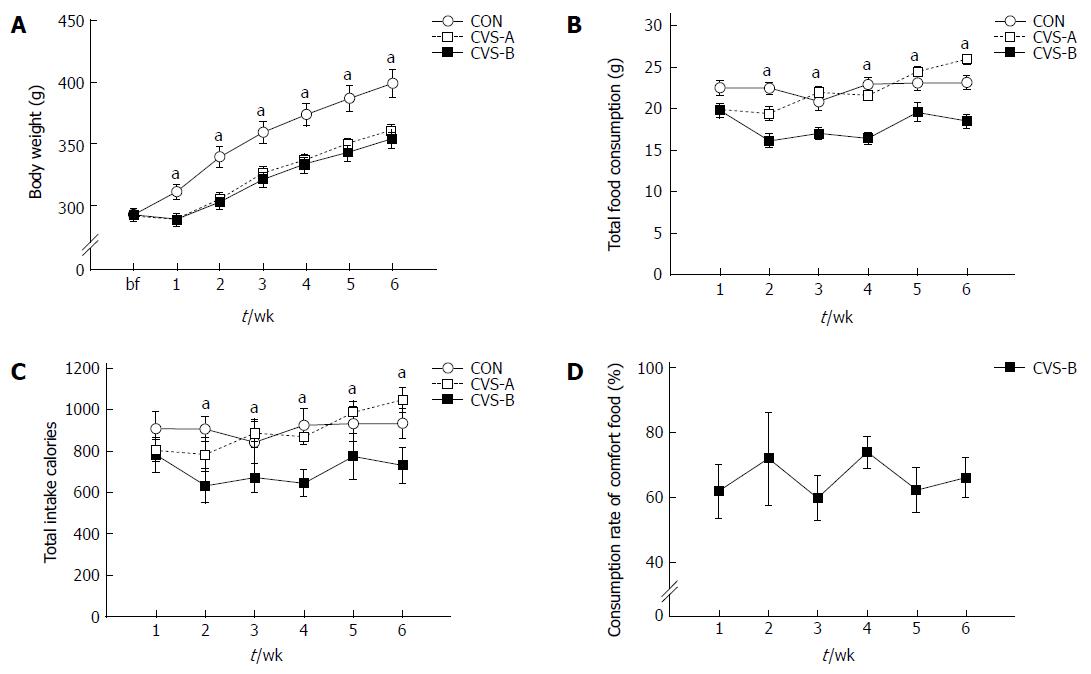
Figure 2 Time-dependent changes of body weight (A), food consumption (B), caloric efficiency (C), and consumption rate of sweet food (D) in each group for 6 wk.
There were significant differences in body weight between control and treated groups. Total food consumption and caloric intake were significantly reduced in the chronic variable stress-B (CVS-B) group only. Denotes significant differences among groups based on one-way analysis of variance and the Bonferroni test (aP < 0.05 vs other groups).
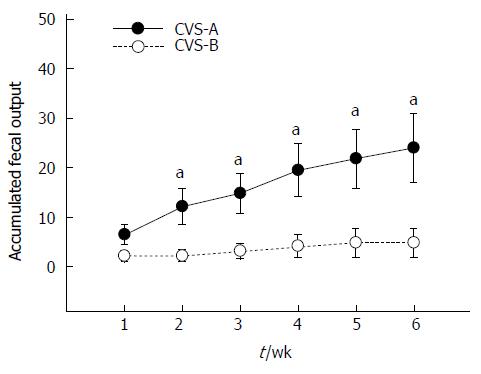
Figure 3 Accumulated fecal pellet output in the chronic variable stress-A and chronic variable stress-B groups.
There was no significant difference in the first week, but accumulated fecal output difference gradually increased with time. Statistical analysis was performed using repeated measures ANOVA and unpaired t test in each week between groups (aP < 0.05 vs chronic variable stress (CVS)-B group).
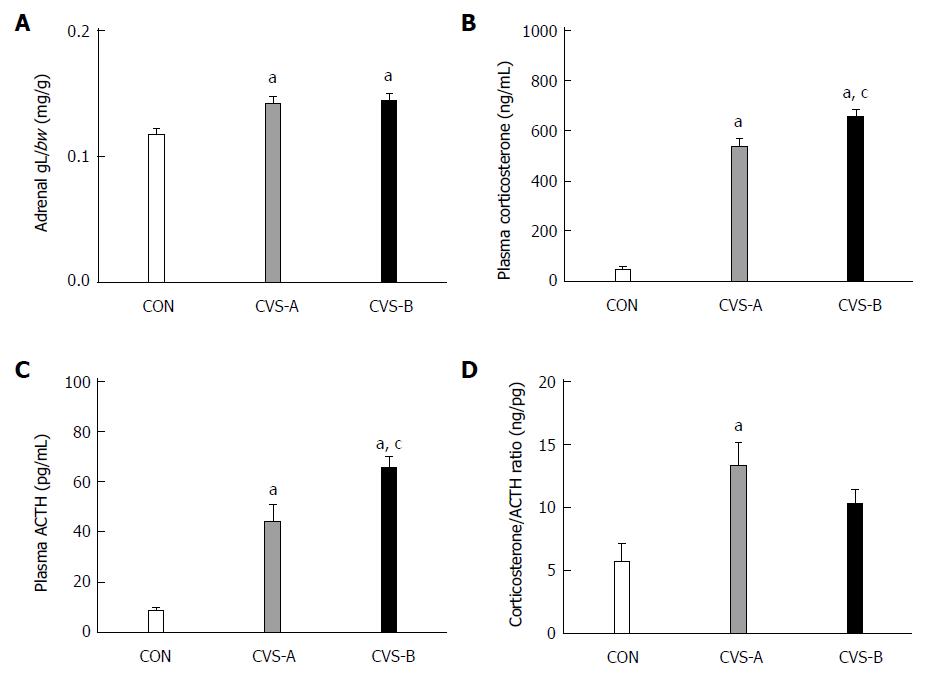
Figure 4 Relative weight of the adrenal gland (A), plasma corticosterone levels (B), ACTH levels (C), and the ratio of corticosterone/ACTH following the 6-wk stress experiment.
Denotes significant difference between control and other groups (aP < 0.05 vs control groups). There was a significant difference in plasma corticosterone and adrenocorticotropic hormone (ACTH) concentrations between CON and the other groups. Denotes significant difference between chronic variable stress (CVS)-A and CVS-B group (cP < 0.05 vs CVS-A groups). There was a significant difference in plasma corticosterone and ACTH concentration between CVS-A and CVS-B groups. CVS: Chronic variable stress.
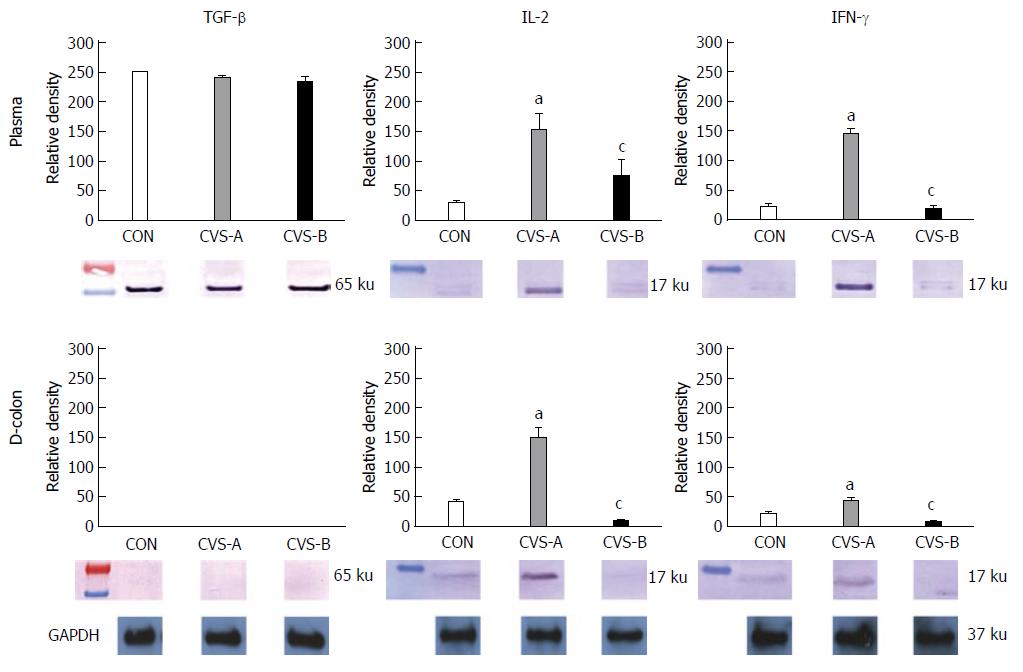
Figure 5 Inflammatory cytokine expressions in the plasma and in the distal colon by western blot analysis following the 6 wk stress experiment.
Note the prominent expressions of interleukin-2 (IL-2) and interferon-γ (IFN-γ) in the distal colon and in the plasma in the chronic variable stress (CVS)-A group only. aDenotes significant difference between control and other groups (aP < 0.05). There was a significant difference in the relative density of IL-2 and IFN-γ in the plasma and distal colon between CON and the other groups. bDenotes significant difference between CVS-A and CVS-B group (cP < 0.05 vs CVS-A groups). There was also a significant difference in the relative density of IL-2 and IFN-γ in the plasma and distal colon between CVS-A and CVS-B groups.
- Citation: Rho SG, Kim YS, Choi SC, Lee MY. Sweet food improves chronic stress-induced irritable bowel syndrome-like symptoms in rats. World J Gastroenterol 2014; 20(9): 2365-2373
- URL: https://www.wjgnet.com/1007-9327/full/v20/i9/2365.htm
- DOI: https://dx.doi.org/10.3748/wjg.v20.i9.2365


