Copyright
©2014 Baishideng Publishing Group Inc.
World J Gastroenterol. Dec 28, 2014; 20(48): 18404-18412
Published online Dec 28, 2014. doi: 10.3748/wjg.v20.i48.18404
Published online Dec 28, 2014. doi: 10.3748/wjg.v20.i48.18404
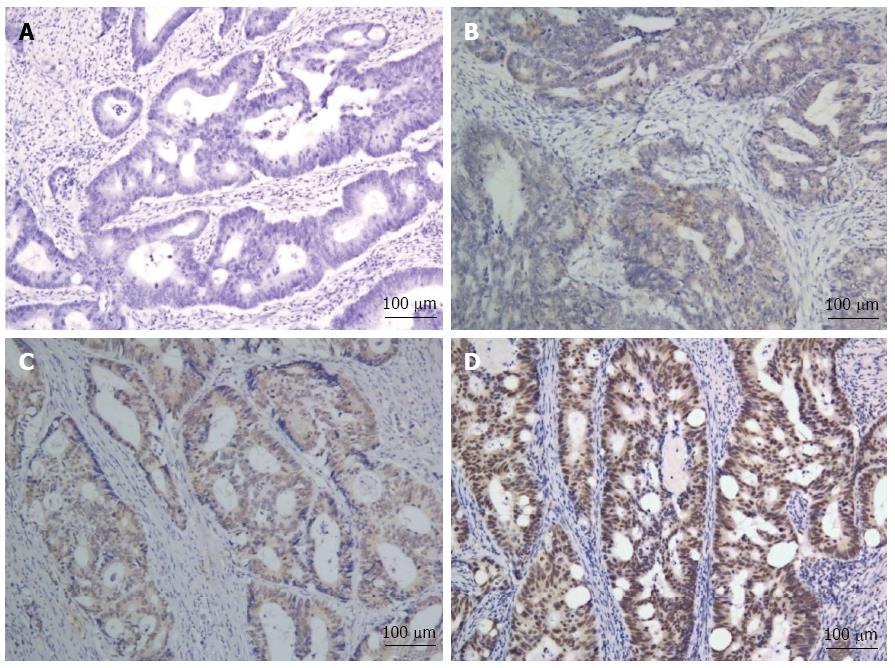
Figure 1 Typical immunohistochemical staining of AT-rich interactive domain 1A (× 100).
A: Negative AT-rich interactive domain 1A (ARID1A) expression; B: Low ARID1A expression; C: Moderate ARID1A expression; D: High ARID1A expression.
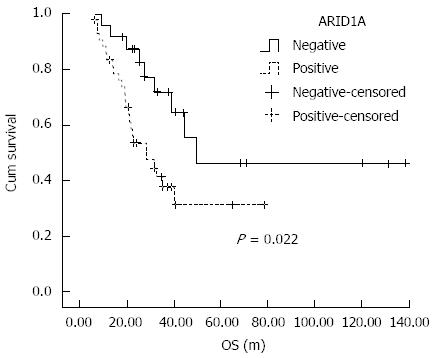
Figure 2 Kaplan-Meier curves.
Kaplan-Meier curves with univariate analyses (log-rank) for stage IV patients with negative AT-rich interactive domain 1A (ARID1A) expression vs positive ARID1A expression.
- Citation: Wei XL, Wang DS, Xi SY, Wu WJ, Chen DL, Zeng ZL, Wang RY, Huang YX, Jin Y, Wang F, Qiu MZ, Luo HY, Zhang DS, Xu RH. Clinicopathologic and prognostic relevance of ARID1A protein loss in colorectal cancer. World J Gastroenterol 2014; 20(48): 18404-18412
- URL: https://www.wjgnet.com/1007-9327/full/v20/i48/18404.htm
- DOI: https://dx.doi.org/10.3748/wjg.v20.i48.18404


