Copyright
©2014 Baishideng Publishing Group Inc.
World J Gastroenterol. Dec 28, 2014; 20(48): 18306-18315
Published online Dec 28, 2014. doi: 10.3748/wjg.v20.i48.18306
Published online Dec 28, 2014. doi: 10.3748/wjg.v20.i48.18306
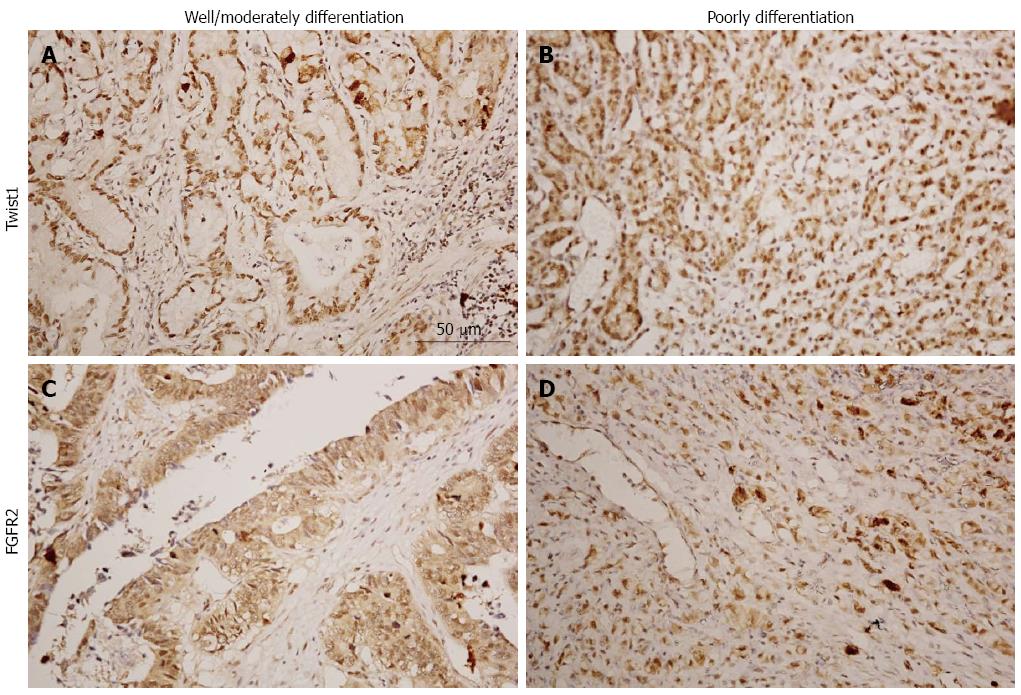
Figure 1 Representative immunohistochemistry figures of Twist1-positive (A) and fibroblast growth factor receptor 2-positive (B) cells in well/moderately differentiated adenocarcinomas, and Twist1-positive (C) and fibroblast growth factor receptor 2-positive (D) cells in poorly differentiated adenocarcinomas.
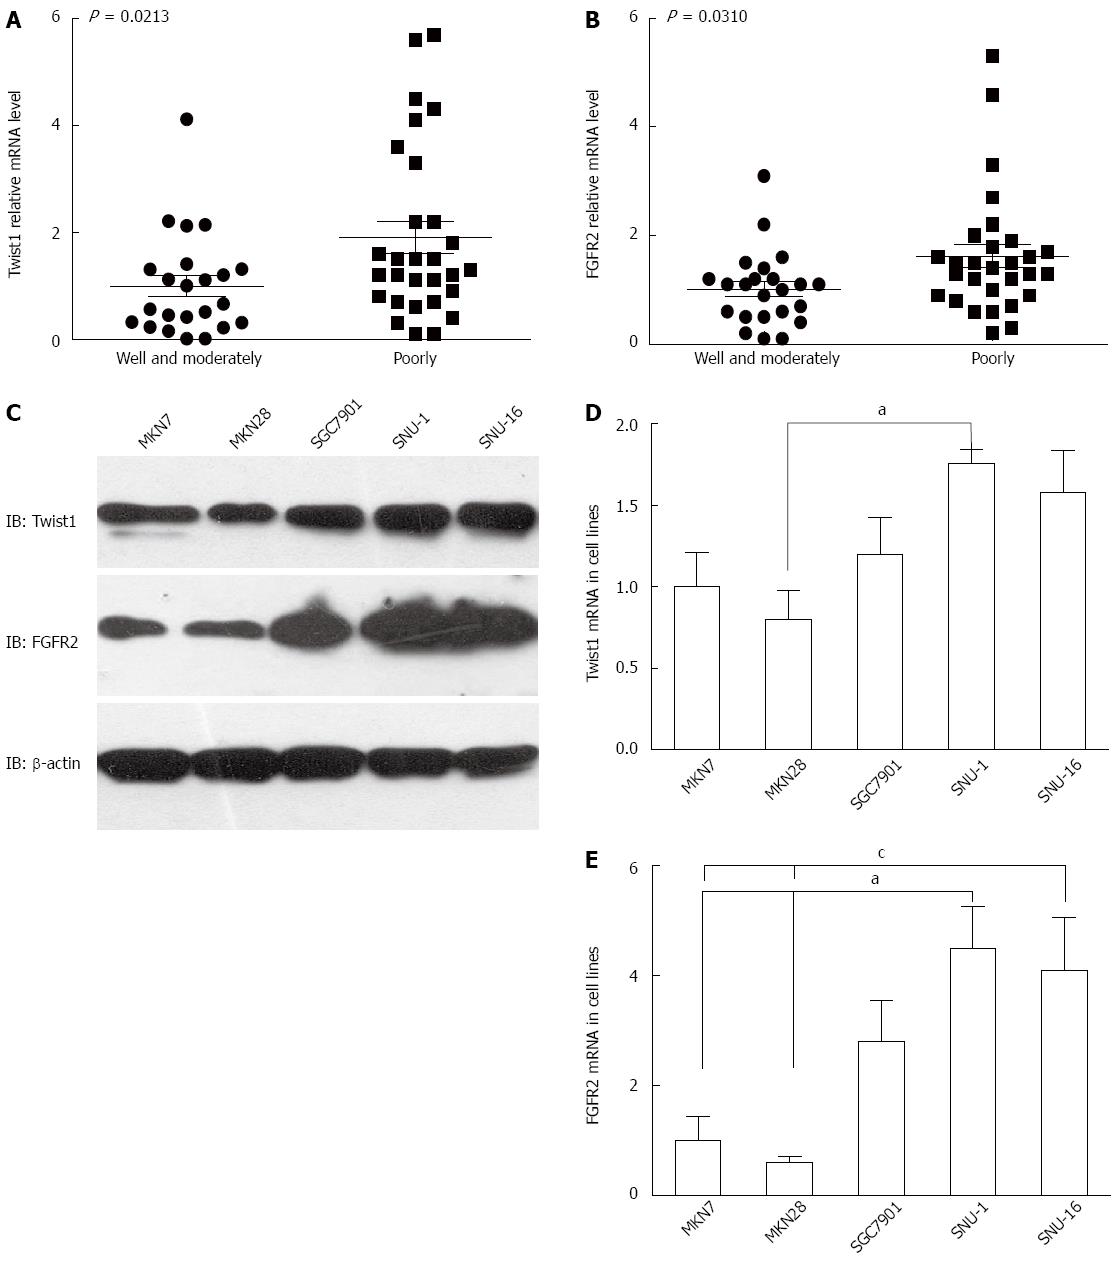
Figure 2 High Twist1 and fibroblast growth factor receptor 2 expression is significantly associated with poor differentiation in gastric cancer tissues and cell lines.
Poorly differentiated gastric cancer has higher Twist1 (A) and fibroblast growth factor receptor (FGFR) 2 (B) mRNA than well/moderately differentiated adenocarcinomas. Twist1 and FGFR2 mRNAs of 23 cases of well/moderately differentiated adenocarcinomas and 29 cases of poorly differentiated adenocarcinomas were detected by QPCR. The mean Twist1 and FGFR2 mRNA levels in well/moderately differentiated adenocarcinomas was set as baseline, and mRNA level in poorly differentiated adenocarcinomas was standardized with ratio to the baseline. The difference between poorly and well/moderately differentiated adenocarcinomas was analyzed by Student’s t test (C). Twist1 and FGFR2 expression in cell lines with different stages of differentiation was detected by immunoblotting. Poorly differentiated SNU-1 and SNU-6 cells had higher Twist1 and FGFR2 levels than well-differentiated MKN7 and MKN28 cells. Twist1 (D) and FGFR2 (E) mRNA levels in cell lines with different stages of differentiation were detected by QPCR. D: mRNA of Twist1 in SNU-1 cells was significantly higher than in MKN28 cells; E: mRNA of FGFR2 in SNU-1 or SNU-16 cells was significantly higher than in MKN7 or MKN28 cells. Data from three independent experiments were analyzed by Student’s t test and displayed as mean ± SE. aP < 0.05, SNU-1 vs MKN7/MKN28; cP < 0.05, SNU-16 vs MKN7/MKN28.
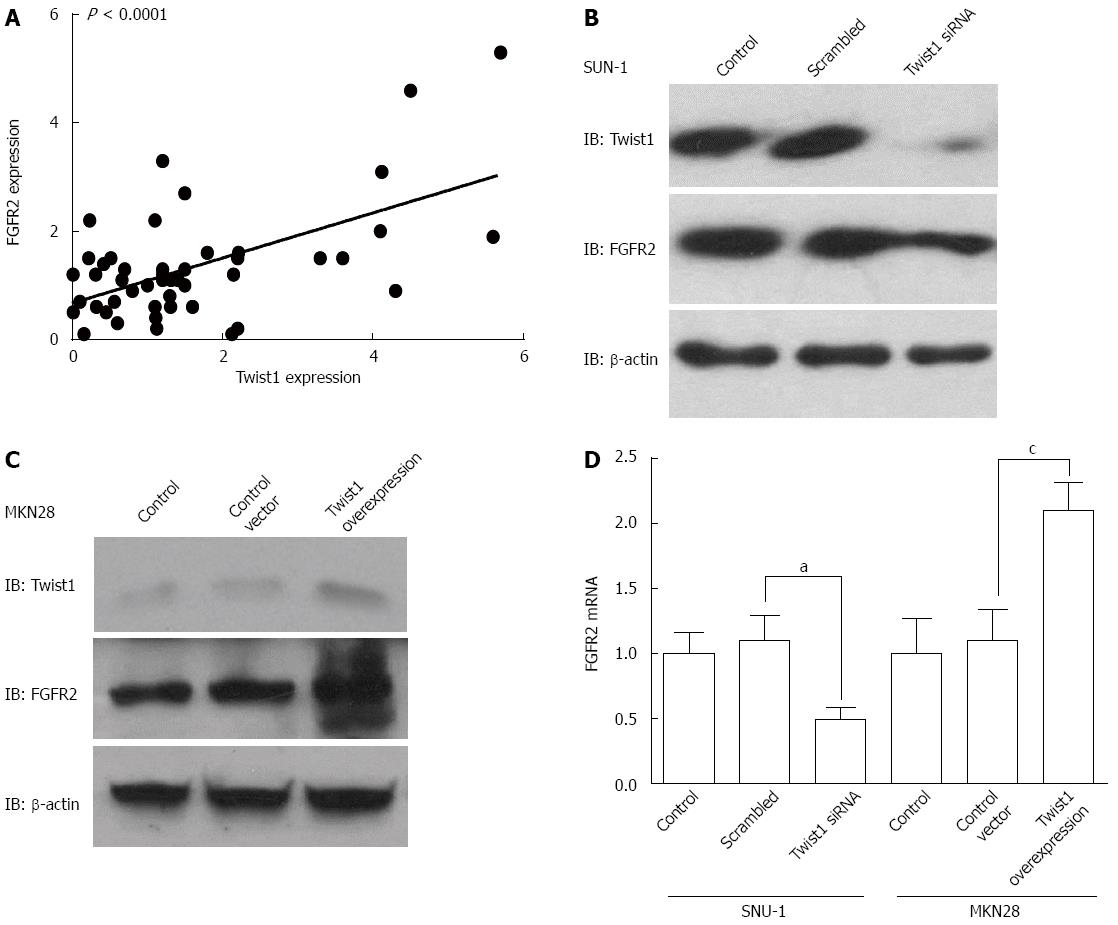
Figure 3 Twist1 can promote fibroblast growth factor receptor 2 expression in gastric cancer cell lines.
A: Twist1 mRNA had a significant association with fibroblast growth factor receptor (FGFR) 2 mRNA level. The correlation between Twist1 and FGFR2 mRNA level was analyzed by Pearson’s test (P < 0.001); B: FGFR2 expression decreased along with Twist1 knockdown in SNU-1 cells. In SNU-1 cells, Twist1 knockdown was accomplished by Twist1 siRNA transfection. Cells were lysed 48 h after siRNA transfection and detected by primary antibody to FGFR2 with immunoblotting; C: FGFR2 expression was elevated by Twist1 overexpression in MKN28 cells. Forty-four hours after transfection with pFLAG-FGFR2 or control vector, MKN28 cells were lysed and FGFR2 expression was detected; D: FGFR2 mRNA level was regulated by Twist1 overexpression or knockdown. Total mRNA was extracted in SNU-1 cells 48 h after transient transfection of Twist1 siRNA or Twist1 vector. FGFR2 mRNA level was evaluated with QPCR. FGFR2 expression decreased when Twist1 was knocked down and increased when Twist1 was overexpressed. aP < 0.05, Twist1 siRNA vs scrambled RNA; cP < 0.05, Twist1 overexpression vs control vector.
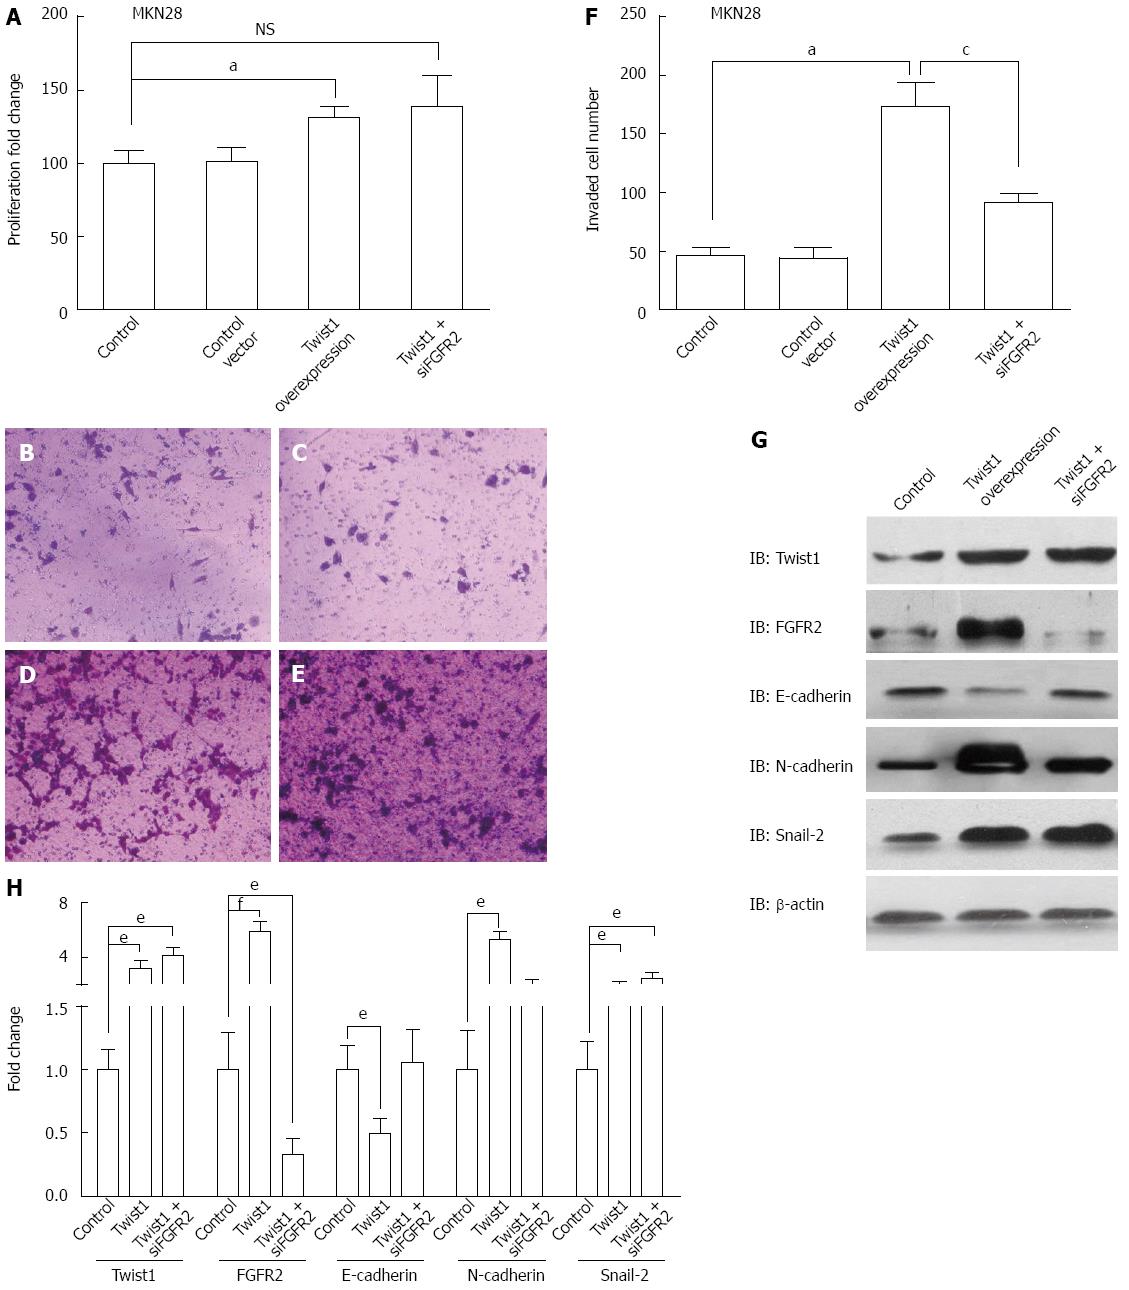
Figure 4 Fibroblast growth factor receptor 2 is required in Twist1-induced invasion and epithelial-mesenchymal transition rather than proliferation.
A: Fibroblast growth factor receptor (FGFR) 2 knockdown did not block Twist1-induced proliferation in MKN28 cells. Proliferative ability was assessed by MTT assay in MKN28 48 h after transfection with Twist1 vector and FGFR2 siRNA. Twist1 overexpression promoted proliferation, and FGFR2 knockdown had little influence on that. Data are displayed as mean ± SE from three independent experiments. aP < 0.05 Twist1 overexpression vs control group. N.S.=not significant; B-E: Representative Transwell figures of MKN28 without transfection (B), and MKN28 transfected with control pFLAG-CMV2 vector (C), pFLAG-Twist1 vector (D), and pFLAG-Twist1 + siFGFR2 (E); F: Invasive cell number was counted and analyzed by Student’s t test. Invasive ability was evaluated by Transwell assay 48 h after transfection of Twist1 vector and FGFR2 siRNA. The invasive ability was markedly elevated by Twist1 overexpression and this tendency decreased significantly when FGFR2 was knocked down by siRNA, indicating that FGFR2 played an essential part in Twist1-induced invasion in MKN28 cells. Data were acquired from three independent experiments and displayed as mean ± SE; aP < 0.05 Twist1 overexpression vs control; cP < 0.05 Twist1 + siFGFR2 vs Twist1 overexpression; G: FGFR2 was partly required in Twist1-induced EMT. Twist1 overexpression significantly promoted E-cadherin decrease, and N-cadherin and Snail-2 increase, demonstrating that Twist1 promoted EMT in MKN28 cells. When FGFR2 was knocked down and Twist1 was overexpressed, the change in E-cadherin and N-cadherin was impaired, whereas there was little change in Snail2, indicating that FGFR2 played an essential role in Twist1-induced EMT. (H) Signals from (G) were quantified by Image J software. Data were from 5 independent experiments, analyzed by Student-t test and displayed by ± SE. eP < 0.05 vs corresponding control group respectively; fP < 0.01 vs control group regarding to FGFR2 expression.
-
Citation: Zhu DY, Guo QS, Li YL, Cui B, Guo J, Liu JX, Li P. Twist1 correlates with poor differentiation and progression in gastric adenocarcinoma
via elevation of FGFR2 expression. World J Gastroenterol 2014; 20(48): 18306-18315 - URL: https://www.wjgnet.com/1007-9327/full/v20/i48/18306.htm
- DOI: https://dx.doi.org/10.3748/wjg.v20.i48.18306


