Copyright
©2014 Baishideng Publishing Group Inc.
World J Gastroenterol. Dec 28, 2014; 20(48): 18260-18270
Published online Dec 28, 2014. doi: 10.3748/wjg.v20.i48.18260
Published online Dec 28, 2014. doi: 10.3748/wjg.v20.i48.18260
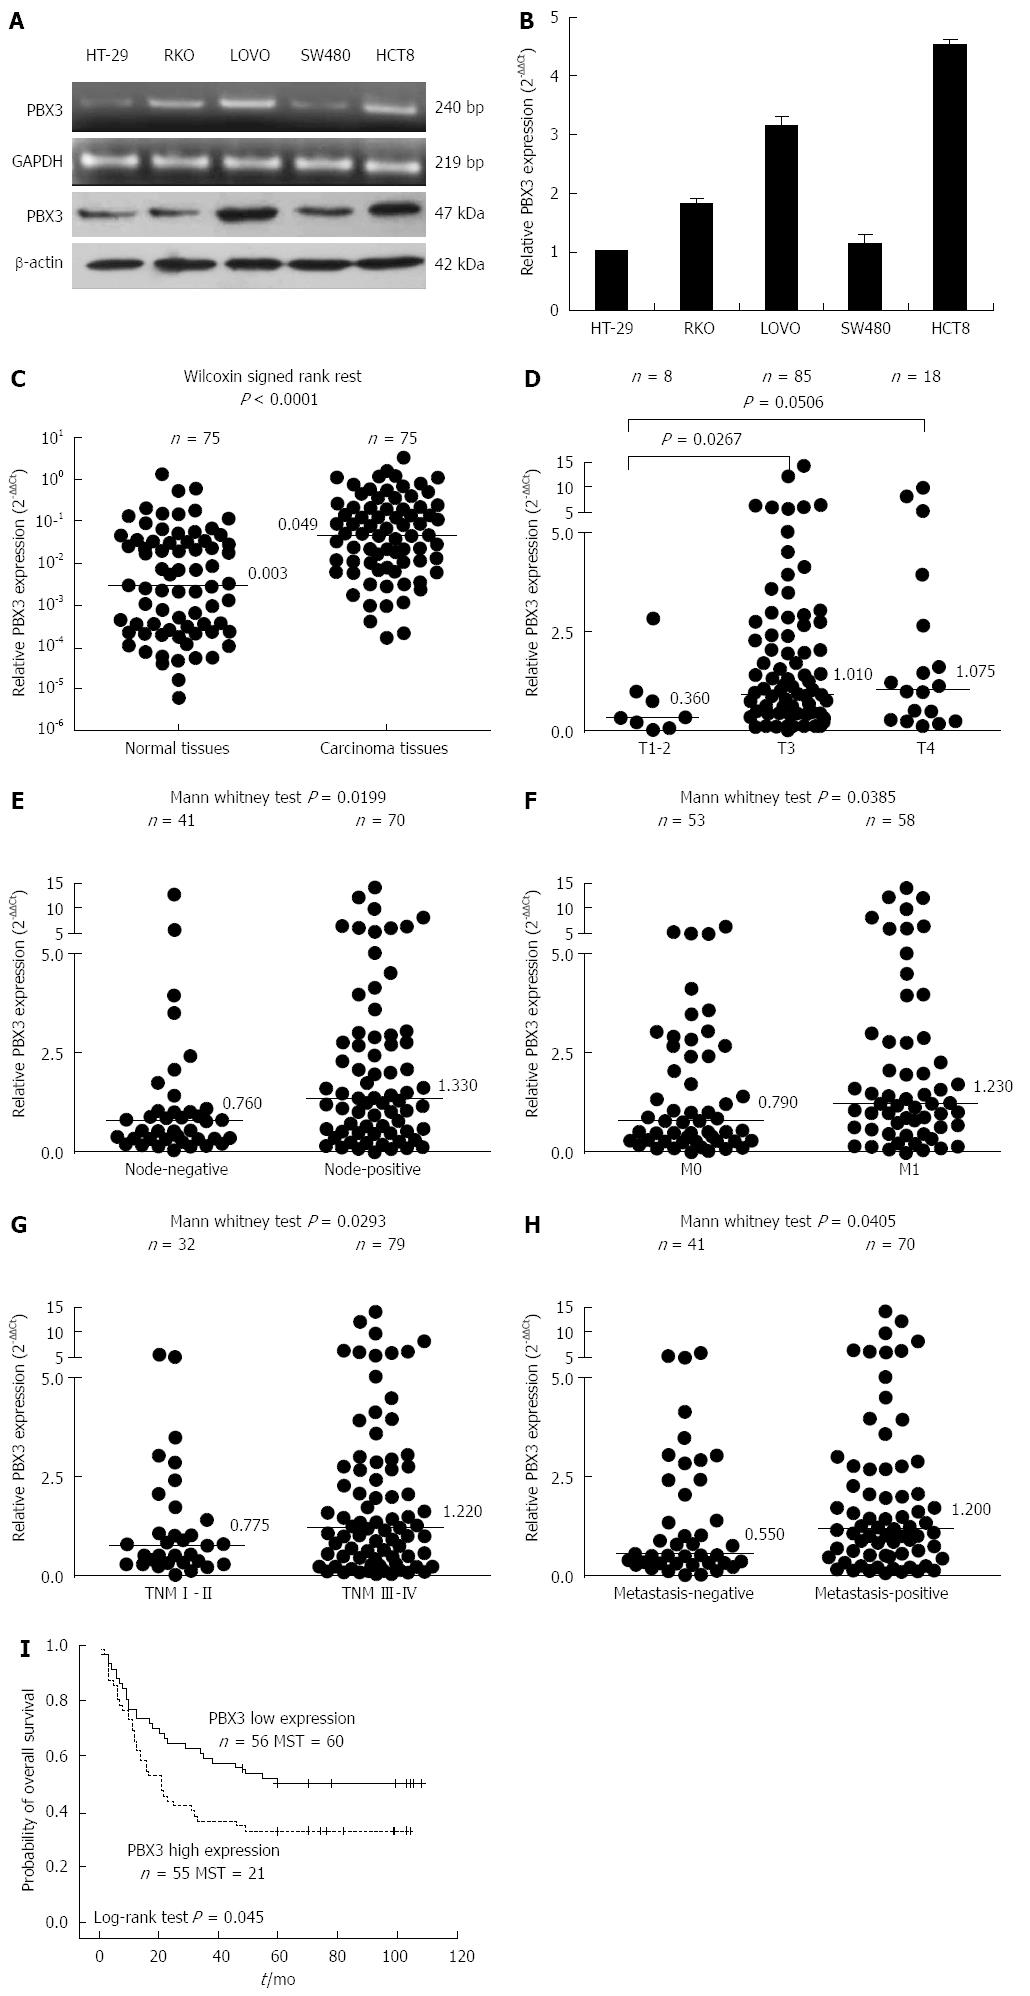
Figure 1 Analysis of pre-B-cell leukemia homeobox 3 expression in colorectal cancer cell lines and specimens.
A: Expression levels of pre-B-cell leukemia homeobox (PBX) 3 in LOVO and HCT8 cell lines with relatively high invasive potential were higher than in HT-29 and SW480 cells with low invasive potential, by RT-PCR and Western blot; B: Results in (A) were confirmed by Q-PCR. Data are presented as mean ± SD calculated from three independent experiments run in triplicate; C: Expression level of PBX3 in cancer tissues was significantly higher than that in adjacent normal tissues (n = 75); D-H: High level of PBX3 expression was correlated with local tissue invasion (D), lymph node metastasis (E), synchronous metastasis (F), advanced TNM stage (G), and distant metastasis (H, synchronous and metachronous metastasis). Horizontal lines in (C-H) indicate the median values of PBX3 expression for each group relative to GAPDH; I: Kaplan-Meier survival curves for CRC patients grouped by a cut-off value of median expression level of PBX3 indicated that patients with higher PBX3 displayed a shorter overall survival time after surgery. Note that (D-H) were generated from the corresponding data in Table 1.
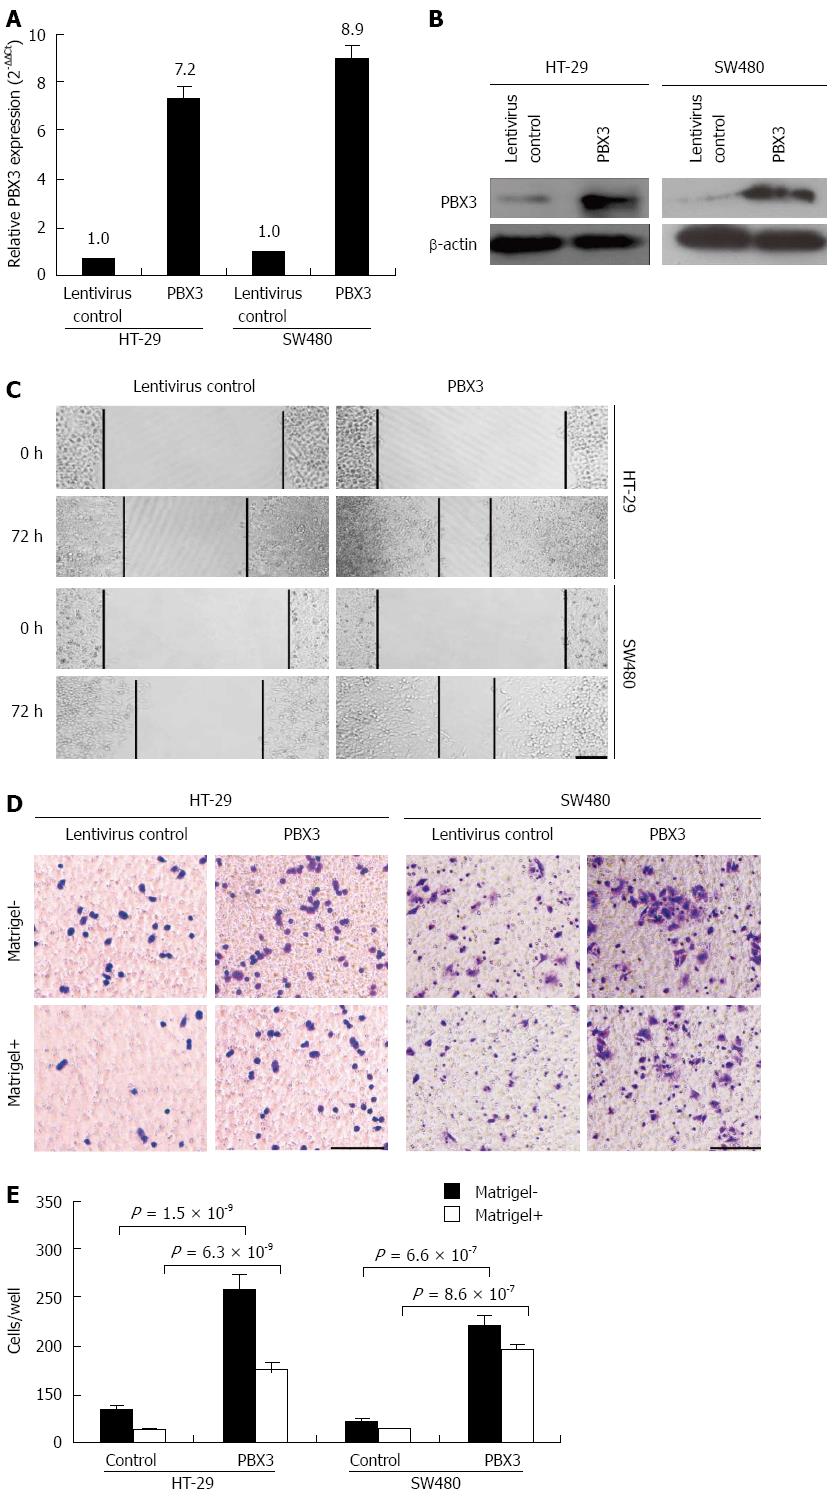
Figure 2 Ectopic expression of pre-B-cell leukemia homeobox 3 promotes cell spreading, migration and invasion.
A, B: Relative expression of PBX3 at both mRNA and protein levels was greatly improved in HT-29 and SW480 cells after infection with PBX3-overexpressing lentivirus compared with the corresponding control cells. Ectopic expression of PBX3 promoted spreading of HT-29 and SW480 cells, in a wound healing assay (C), increased cell migration and invasion via Boyden chamber assay without and with Matrigel, respectively (D). Horizontal bar: 50 μm; E: Quantification results of migrating and invading cells through the Transwell membrane. Data represent mean ± SD of three independent experiments run in triplicate. P-values are calculated using Student’s t test.
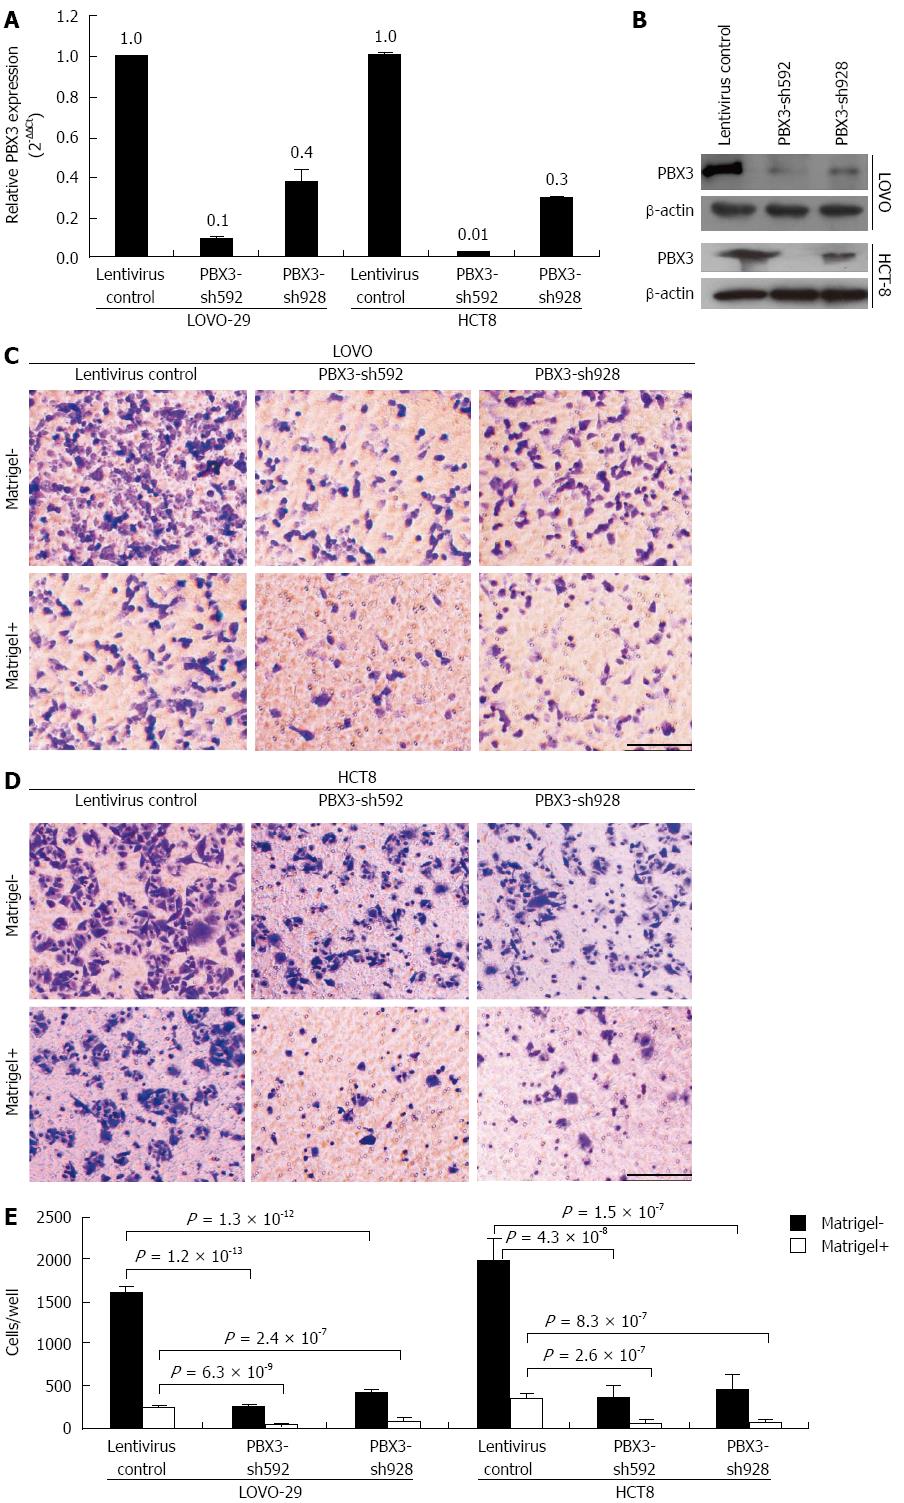
Figure 3 Interference of expression of pre-B-cell leukemia homeobox 3 by shRNAs suppresses cell migration and invasion in vitro.
A, B: Expression levels of PBX3 mRNA and protein were significantly decreased after infection with PBX3-shRNA lentivirus compared with the controls as detected by qRT-PCR and Western blot, respectively. Data in (A) are presented as mean ± SD from three independent experiments run in triplicate; C, D: Cell migration and invasion decreased significantly after inhibition of PBX3 expression in LOVO cells (C) and HCT8 cells (D), using a Boyden chamber assay without and with Matrigel. Bar: 50 μm. (E) Quantification of migrating and invading cells through the Transwell membrane are displayed as mean ± SD of three independent experiments in triplicate. P-values are calculated using Student’s t test.
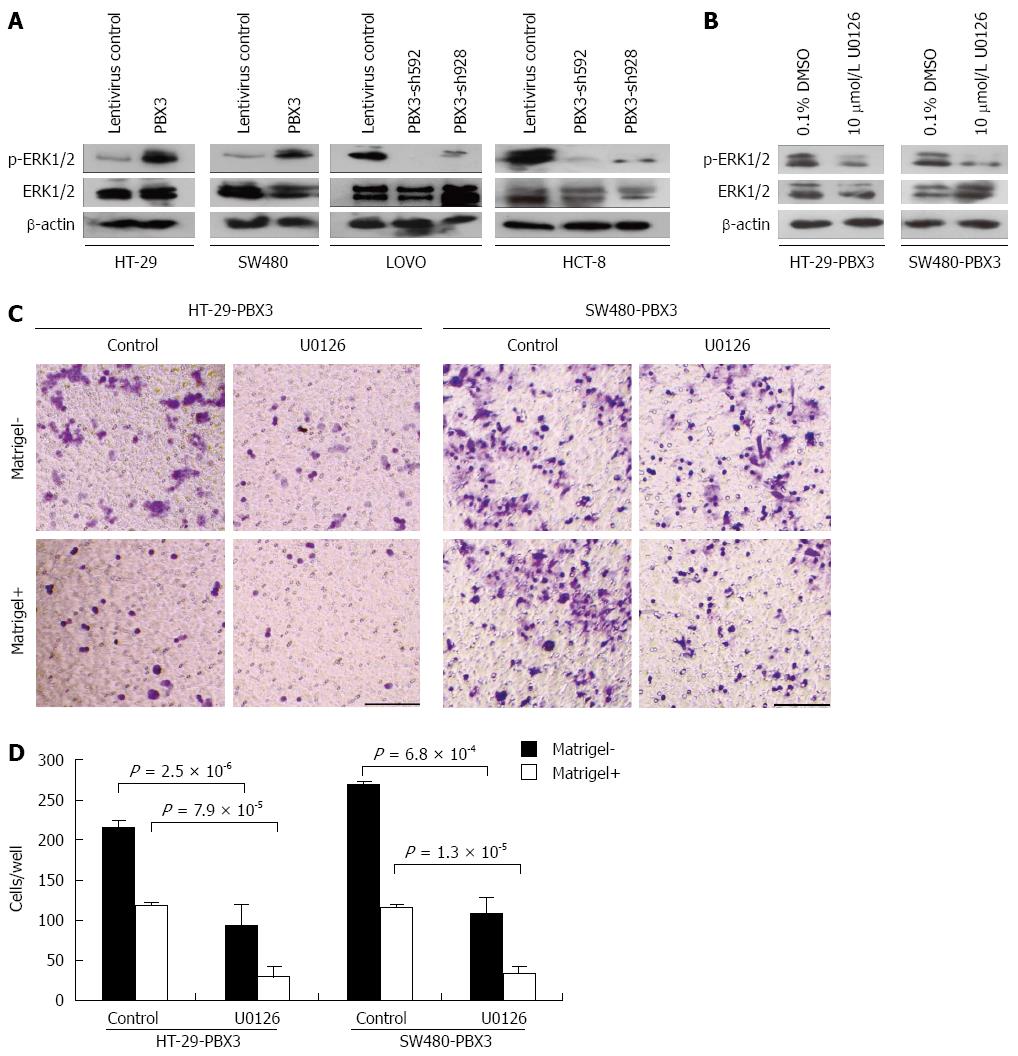
Figure 4 Effect of pre-B-cell leukemia homeobox 3 overexpression on cell invasion is mediated by MAPK/ERK pathway.
A: Expression levels of phospho-ERK1/2 were upregulated after overexpression and downregulated after silencing PBX3; B: Western blot showed that upregulation of phospho-ERK1/2 in PBX3-overexpressing cells was reduced after treatment with U0126 for 48 h; C: Boyden chamber assay showed that migration and invasion were significantly decreased after U0126 treatment in PBX3-overexpressing HT-29 and SW480 cells. Bar: 50 μm. D: The migrating and invading cells through the Transwell membrane were counted and plotted. Data are presented as mean ± SD of three independent experiments. P-values are calculated using Student’s t test.
-
Citation: Han HB, Gu J, Ji DB, Li ZW, Zhang Y, Zhao W, Wang LM, Zhang ZQ. PBX3 promotes migration and invasion of colorectal cancer cells
via activation of MAPK/ERK signaling pathway. World J Gastroenterol 2014; 20(48): 18260-18270 - URL: https://www.wjgnet.com/1007-9327/full/v20/i48/18260.htm
- DOI: https://dx.doi.org/10.3748/wjg.v20.i48.18260


