Copyright
©2014 Baishideng Publishing Group Inc.
World J Gastroenterol. Dec 21, 2014; 20(47): 17863-17876
Published online Dec 21, 2014. doi: 10.3748/wjg.v20.i47.17863
Published online Dec 21, 2014. doi: 10.3748/wjg.v20.i47.17863
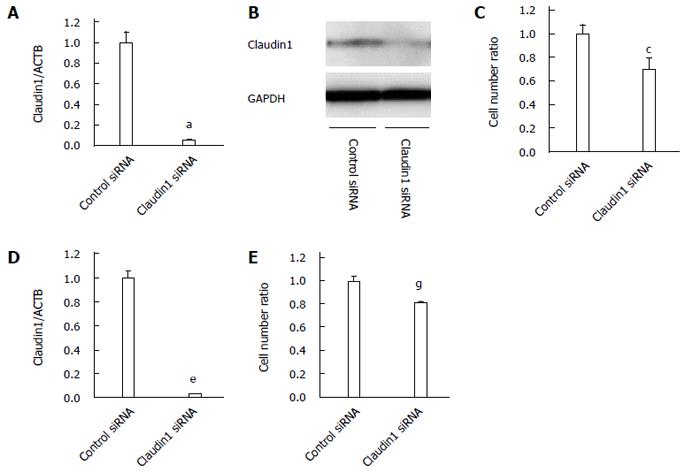
Figure 1 Claudin 1 controls cell proliferation in MKN28 cells.
A: Claudin 1 siRNA effectively reduced the mRNA levels of claudin 1 in MKN28 cells. Mean ± SE. n = 3. aP < 0.05 vs control siRNA; B: Western blotting revealed that claudin 1 siRNA reduced the protein levels of claudin 1 in MKN28 cells; C: Downregulation of claudin 1 inhibited the proliferation of MKN28 cells. The number of cells was counted 48 h after siRNA transfection. Mean ± SE. n = 3. cP < 0.05 vs control siRNA; D: A second independent claudin 1 siRNA also reduced the mRNA levels of claudin 1 in the MKN28 cells. Mean ± SE. n = 3. eP < 0.05 vs control siRNA; E: A second independent claudin 1 siRNA also inhibited the proliferation of MKN28 cells. The number of cells was counted 48 h after siRNA transfection. Mean ± SE. n = 3. gP < 0.05 vs control siRNA.
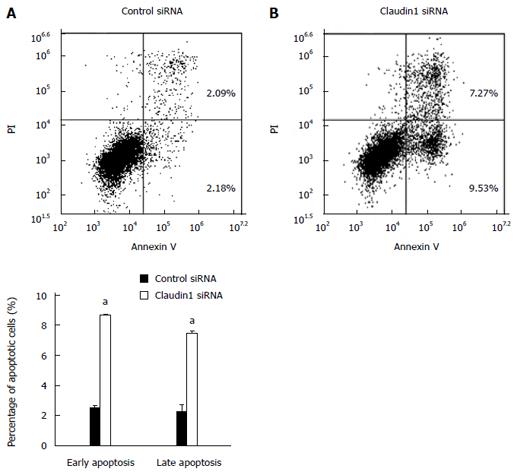
Figure 2 Claudin 1 controls apoptosis in MKN28 cells.
Down-regulation of claudin 1 induced both early (annexin V positive/PI negative) and late apoptosis (annexin V/PI double positive) in MKN28 cells 48 h after siRNA transfection. Mean ± SE. n = 3. aP < 0.05 vs control siRNA.
Figure 3 Claudin 1 controlls cell migration and invasion in MKN28 cells.
Down-regulation of claudin 1 significantly inhibited cell migration and invasion in MKN28 cells. Cell migration and invasion were determined by Boyden chamber assay. Mean ± SE. n = 3. aP < 0.05 vs control siRNA.
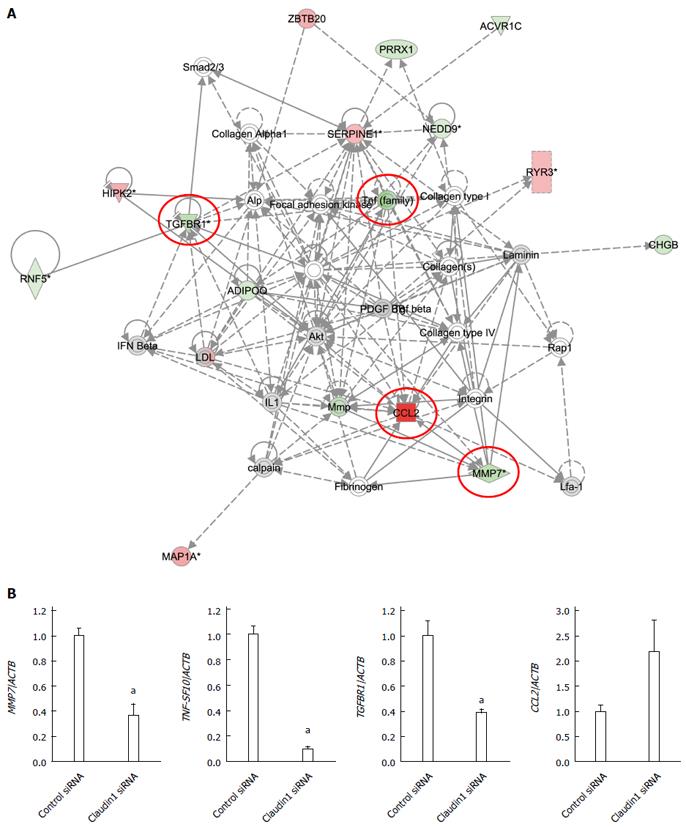
Figure 4 Analysis of gene expression change in claudin 1 siRNA transfected MKN28 cells.
A: One of the top-ranked signaling networks related to claudin 1 down-regulation according to ingenuity pathway analysis. Red and green indicate genes whose expression levels were higher or lower, respectively, than reference RNA levels. Genes analyzed for verification were highlighted by red circles; B: Verification of gene expression by real-time quantitative RT-PCR. The expression levels of for selected genes MMP7, TNF-SF10, TGFBR1, and CCL2 in claudin 1 siRNA transfected MKN28 cells were compared with those in control siRNA transfected cells. Gene expression levels were normalized to the level of ACTB. Mean ± SE. n = 3. aP < 0.05 vs control siRNA.
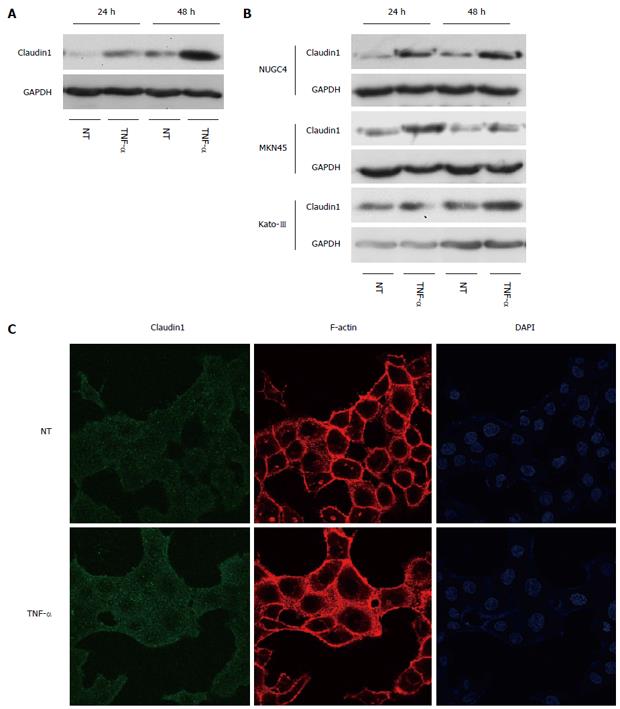
Figure 5 Tumor necrosis factor α induces claudin 1 expression in gastric cancer cells.
A: Western blotting revealed that the basal expression level of claudin 1 was increased in a time-dependent manner at 24 and 48 h, which was further increased by tumor necrosis factor α (TNF-α) (20 ng/mL) stimulation in MKN28 cells; B: Western blotting revealed that the expression level of claudin 1 was increased by TNF-α (20 ng/mL) stimulation in several gastric cancer cell lines, including NUGC4, MKN45 and Kato-III; C: At 24 h after treating the cells with TNF-α, expression of claudin 1 protein was increased mainly in cytoplasm. MKN28 cells were immunostained with an anti-claudin 1 antibody and counterstained F-actin and nuclei with rhodamine phalloidin and DAPI, respectively.
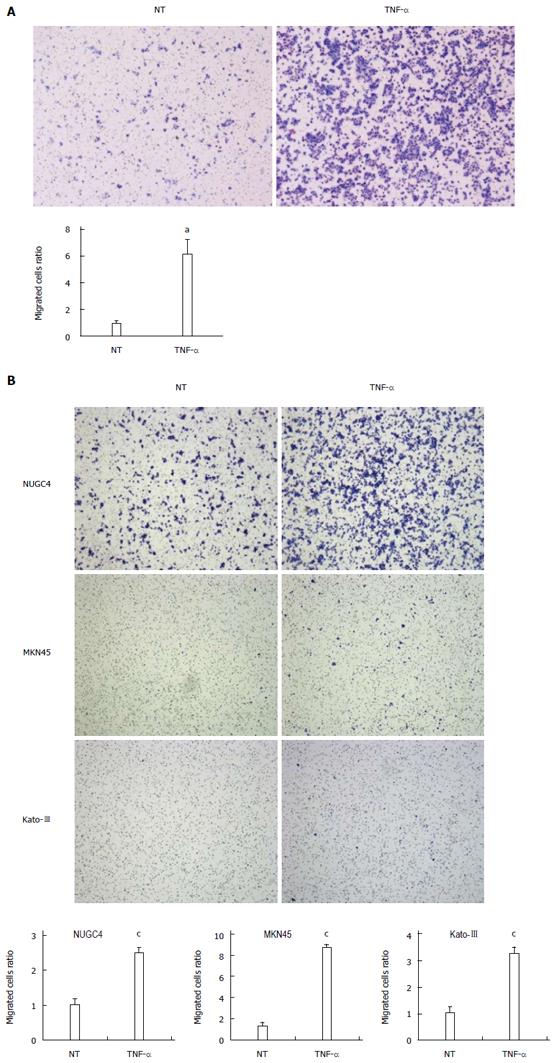
Figure 6 Tumor necrosis factor α induces cell migration in gastric cancer cells.
A: Tumor necrosis factor α (TNF-α) stimulation (20 ng/mL, 24 h) significantly increased cell migration in MKN28 cells. Cell migration was determined by Boyden chamber assay. Mean ± SE. n = 3. aP < 0.05 vs control siRNA, NT; B: TNF-α stimulation (20 ng/mL, 48 h) significantly increased cell migration in several gastric cancer cell lines, including NUGC4, MKN45 and Kato-III. Cell migration was determined by Boyden chamber assay. Mean ± SE. n = 3. cP < 0.05 vs control siRNA. NT: No treatment.
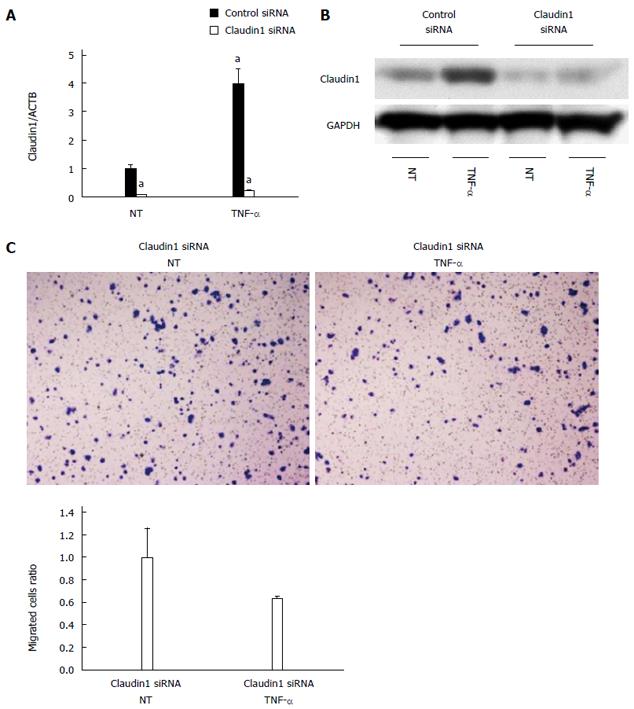
Figure 7 Claudin 1 is important for tumor necrosis factor α-induced cell migration in MKN28 cells.
A: Claudin 1 siRNA effectively reduced both the basal and tumor necrosis factor α (TNF-α)-induced expression of claudin 1 mRNA. Mean ± SE. n = 3. aP < 0.05 vs control siRNA, NT; B: Western blotting revealed that transfection of claudin 1 siRNA effectively reduced both the basal and TNF-α-induced expression of claudin 1 protein; C: TNF-α stimulation (20 ng/mL, 48 h) did not enhance cell migration in the claudin 1 siRNA transfected cells. Cell migration was determined by Boyden chamber assay. Mean ± SE. n = 3. NT: No treatment.
- Citation: Shiozaki A, Shimizu H, Ichikawa D, Konishi H, Komatsu S, Kubota T, Fujiwara H, Okamoto K, Iitaka D, Nakashima S, Nako Y, Liu M, Otsuji E. Claudin 1 mediates tumor necrosis factor alpha-induced cell migration in human gastric cancer cells. World J Gastroenterol 2014; 20(47): 17863-17876
- URL: https://www.wjgnet.com/1007-9327/full/v20/i47/17863.htm
- DOI: https://dx.doi.org/10.3748/wjg.v20.i47.17863


