Copyright
©2014 Baishideng Publishing Group Inc.
World J Gastroenterol. Dec 14, 2014; 20(46): 17558-17567
Published online Dec 14, 2014. doi: 10.3748/wjg.v20.i46.17558
Published online Dec 14, 2014. doi: 10.3748/wjg.v20.i46.17558
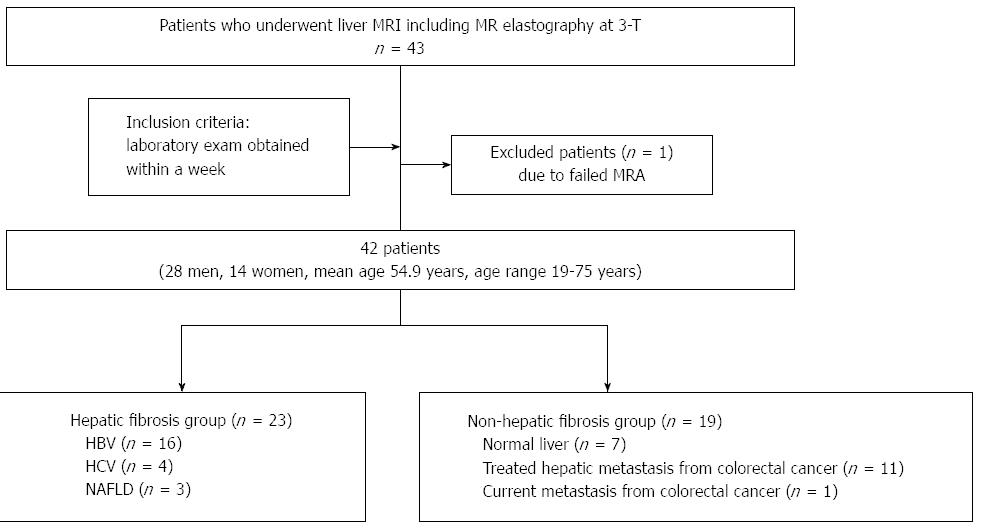
Figure 1 Flow chart of the study profile based on recommended standards for reporting diagnostic accuracy.
MR: Magnetic resonance; MRE: Magnetic resonance elastography; HBV: Hepatitis B virus; HCV: Hepatitis C virus; NAFLD: Non-alcoholic fatty liver disease.
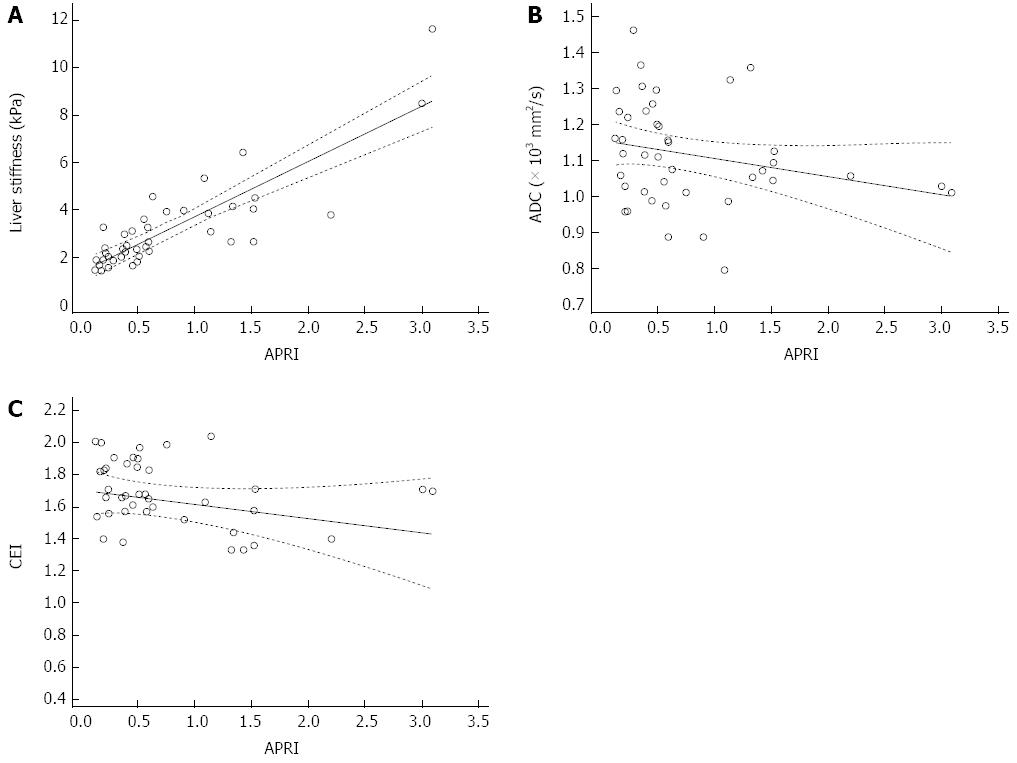
Figure 2 Graphs showing scattergrams and lines of correlation between aspartate aminotransferase to the platelet ratio index score and three magnetic resonance parameters, which are liver stiffness (A), apparent diffusion coefficient (B), and contrast enhancement ratio (C).
Dotted curved lines represent 95%CIs. ADC: Apparent diffusion coefficient; CEI: Contrast enhancement ratio; APRI: Aspartate aminotransferase to the platelet ratio index.
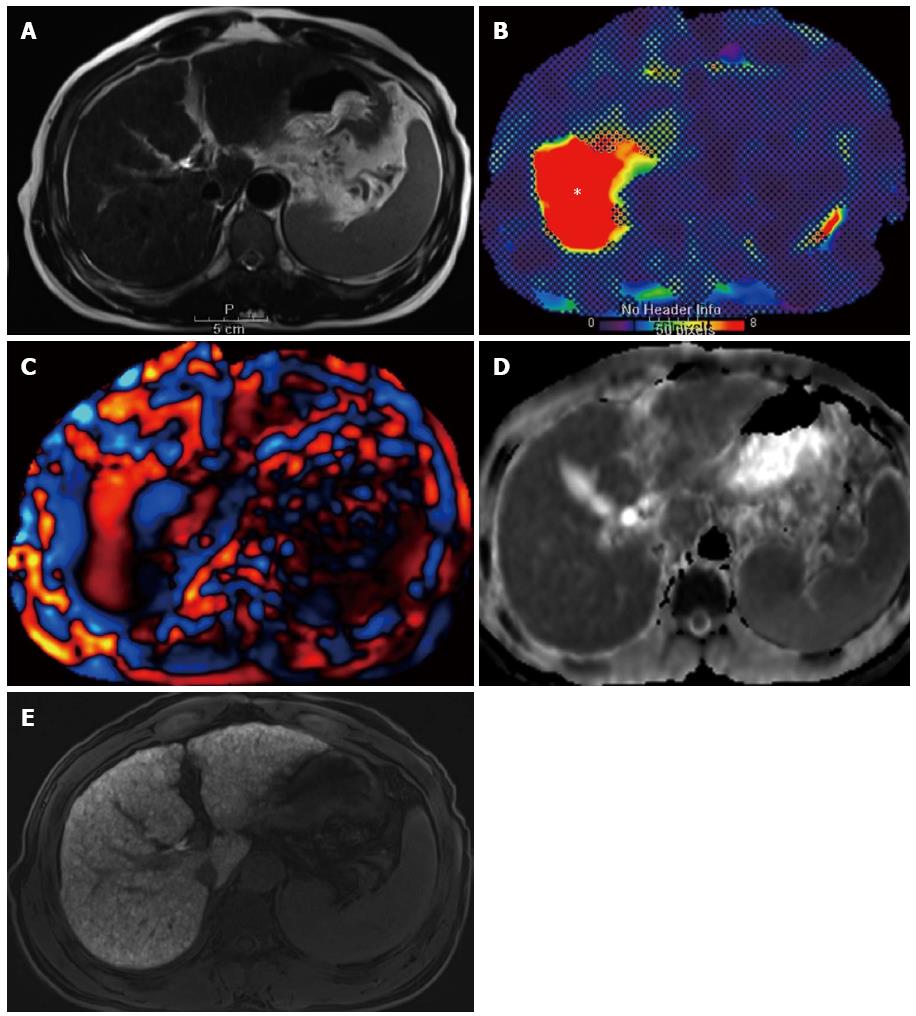
Figure 3 A 58-year-old man in the hepatic fibrosis group, who had hepatitis B virus-associated liver cirrhosis.
A: T2-weighted reference image on which the measurement of three MR parameters were performed; B: MRE (95% confidence map) shows increased stiffness value of 11.64 kPa (asterisk) in the right lobe of the liver; C: Wave image shows elongated wavelength of the corresponding liver parenchyma; D: ADC map of the DWI image with b = 400 at the same level as A. Measured ADC value was 1.011 × 10⁻³ mm2/s; E: Hepatobiliary phase image of gadoxetic acid-enhanced MR at the same level as A. Measured CEI was 1.701. MR: Magnetic resonance; MRE: Magnetic resonance elastography; DWI: Diffusion weighted image; ADC: Apparent diffusion coefficient; CEI: Contrast enhancement ratio.
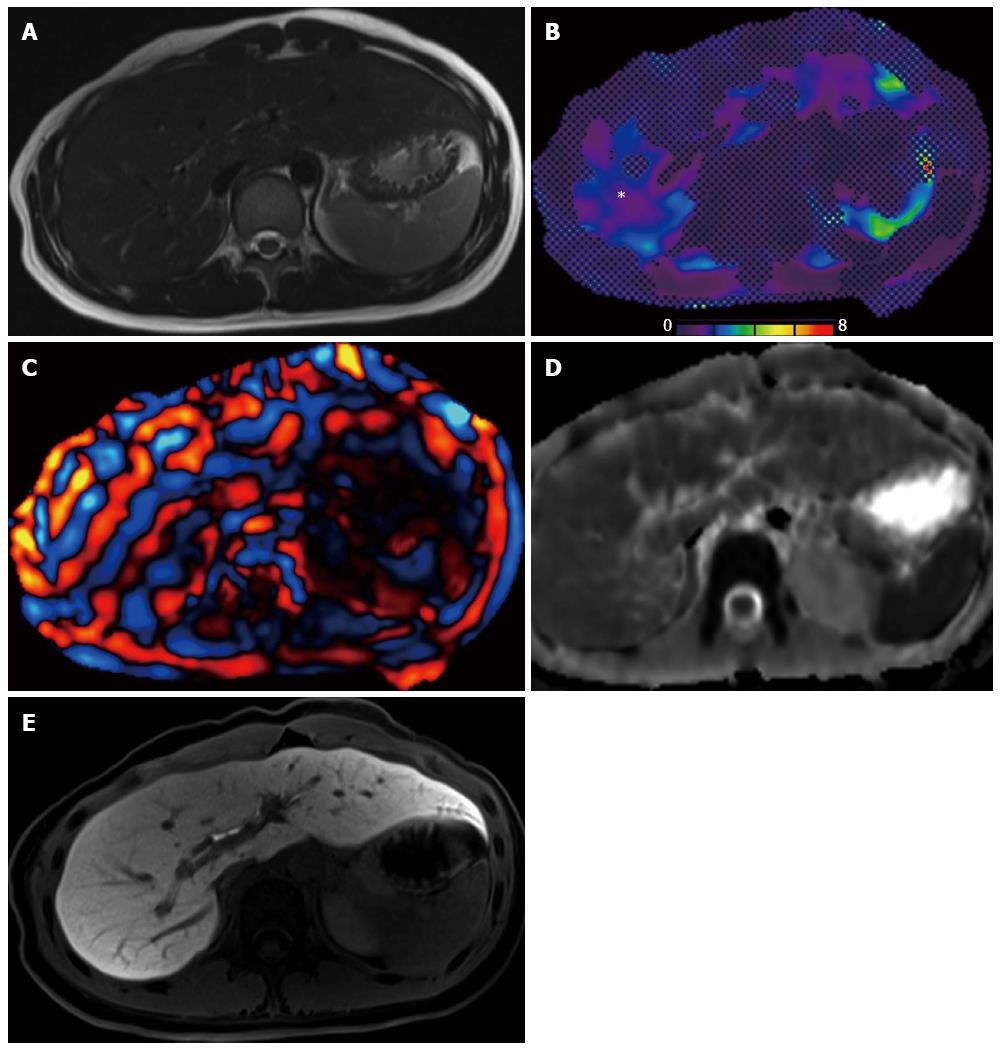
Figure 4 A 20-year-old woman in the non-hepatic fibrosis group, with incidental hepatic mass (biopsy proven focal nodular hyperplasia later) on screening.
A: T2-weighted reference image on which the measurement of three MR parameters were performed; B: MRE (95% confidence map) shows normal range stiffness value of 1.88 kPa (asterisk) in the right lobe of the liver; C: Wave image shows normal range (not elongated) wavelength of the corresponding liver parenchyma; D: ADC map of the DWI image with b = 400 at the same level as A. Measured ADC value was 1.119 × 10⁻³ mm2/s; E: Hepatobiliary phase image of gadoxetic acid-enhanced MR at the same level as A. Measured CEI was 1.826. MR: Magnetic resonance; MRE: Magnetic resonance elastography; DWI: Diffusion weighted image; ADC: Apparent diffusion coefficient; CEI: Contrast enhancement ratio.
- Citation: Park HS, Kim YJ, Yu MH, Choe WH, Jung SI, Jeon HJ. Three-Tesla magnetic resonance elastography for hepatic fibrosis: Comparison with diffusion-weighted imaging and gadoxetic acid-enhanced magnetic resonance imaging. World J Gastroenterol 2014; 20(46): 17558-17567
- URL: https://www.wjgnet.com/1007-9327/full/v20/i46/17558.htm
- DOI: https://dx.doi.org/10.3748/wjg.v20.i46.17558


