Copyright
©2014 Baishideng Publishing Group Inc.
World J Gastroenterol. Dec 14, 2014; 20(46): 17376-17387
Published online Dec 14, 2014. doi: 10.3748/wjg.v20.i46.17376
Published online Dec 14, 2014. doi: 10.3748/wjg.v20.i46.17376
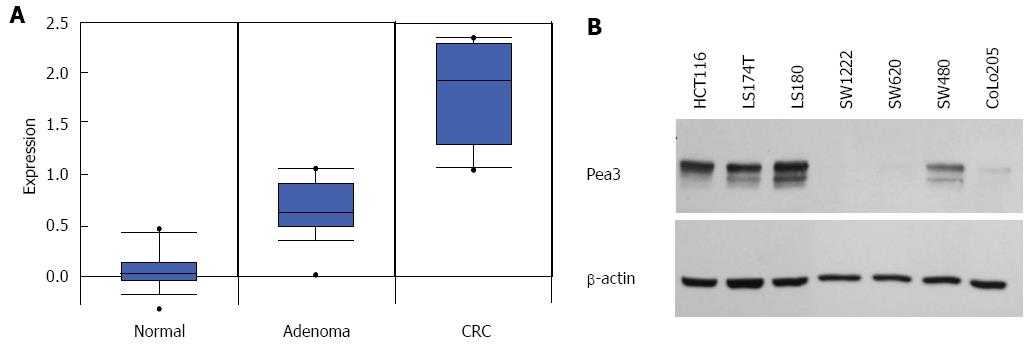
Figure 1 Pea3 expression in normal-adenoma-carcinoma (colon) and human colorectal carcinoma cell lines.
A: Box plot of Pea3 transcript expression in normal colon tissue, adenoma, and adenocarcinoma samples. Oncomine™ compendium was utilized for analysis (Skrzypczak 2 colon sample set). Expression is shown as log2 transformation of median-centered intensity. Black line represents the median; blue box, 25/75 percentile; bars, 10/90 percentile; dots, minimum and maximum values; B: Western blot analysis of Pea3 expression in human colorectal cancer cell lines. Shown are blots for Pea3 and β-actin loading control. Representative of three independent experiments.
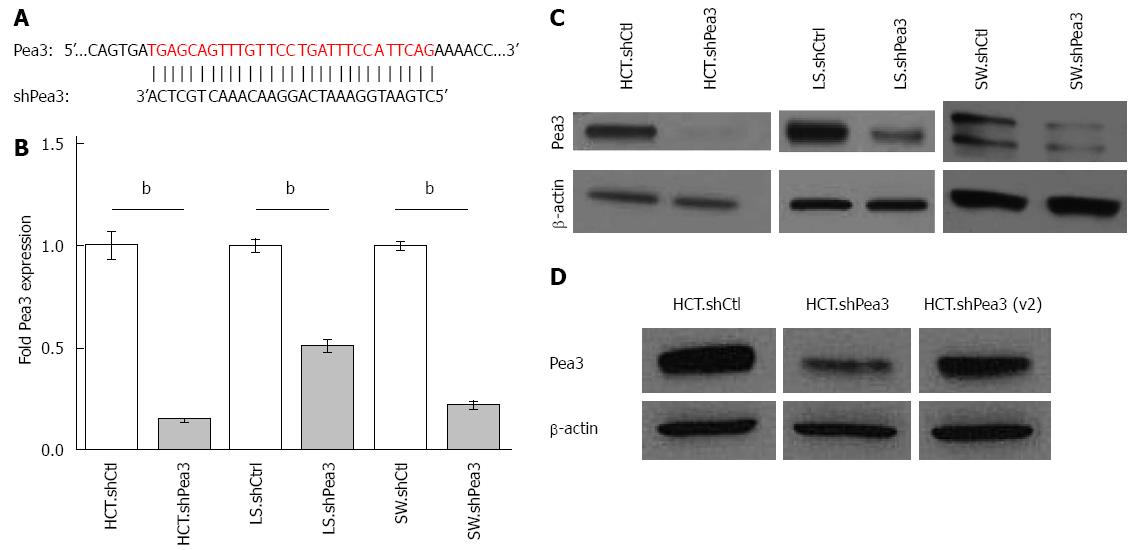
Figure 2 Generation and characterization of short hairpin RNA (shRNA)-mediated interference with Pea3 expression.
A: Nucleotide alignment of Pea3 sequence with shRNA. The shown Pea3 sequence is identical in four published Pea3 splice variants (accession numbers NM_001986.2, NM_001079675.1, NM_001261437.1 and NM_001261438.1). Vertical lines indicate complementary bases; B: Quantitative polymerase chain reaction (qPCR) analysis of Pea3 expression in HCT116, LS174T, and SW480 cells expressing Pea3-specific shRNA (HCT.shPea3, LS.shPea3, and SW.shPea3) or control shRNA (HCT.shCtrl, LS.shCtrl, and SW.shCtrl). Obtained ∆Ct values are normalized to Glyceraldehyde 3-phosphate dehydrogenase (GAPDH) values, and expression is shown as fold change in Pea3 expression relative to cells expressing control shCtrl, bP < 0.01 vs control shRNA; C: Western blot analysis of Pea3 expression in HCT116, LS174T and SW480 cells expressing Pea3-specific shRNA (HCT.shPea3, LS.shPea3, and SW.shPea3) or control shRNA (HCT.shCtrl, LS.shCtrl, and SW.shCtrl). Shown are blots for Pea3 and β-actin loading control. Representative of three independent experiments; D: Western blot analysis of Pea3 expression in HCT116 cells expressing two different Pea3-specific shRNA [HCT.shPea3 and HCT.shPea3(v2)] or control shRNA (HCT.shCtrl). Shown are blots for Pea3 and β-actin loading control. Representative of three independent experiments.
Figure 3 Characterization of invasiveness, anoikis resistance, and proliferative capacity of colorectal carcinoma cells expressing the short hairpin RNA Pea3 (shPea3) construct.
A: Representative images of the 24-h transwell invasion assay using HCT.shPea3, HCT.shPea3(v2) and HCT.shCtrl cells with quantification of the transwell invasion assays. Data are shown as fold change in invasion of shPea3 or shPea3(v2) expressing cells relative to their shCtrl counterparts. bP < 0.01, HCT.shCtrl vs HCT.shPea3; dP < 0.01, LS.shCtrl vs LS.shPea3; fP < 0.01, SW.shCtrl vs SW.shPea3; hP < 0.01, LS.shCtrl vs LS.shPea3; B: Anoikis assay using the stable HCT116 and LS174T transductants. Cell death was assessed using dye exclusion, and the fraction of surviving cells after 2 d (HCT116) or 5 d (LS174T) was plotted. bP < 0.01, HCT.shCtrl vs HCT.shPea3; dP < 0.01, LS.shCtrl vs LS.shPea3; C: In vitro proliferation assay of HCT.shPea3 and HCT.shCtrl cells (left panel), as well as LS.shPea3 and LS.shCtrl cells (right panel). Cells were plated in 96-wells in 4-fold dilution series, followed by OD reading at 495 nm for quantification (shown). Area under curve analysis was performed for statistical significance; D: In vivo tumour xenograft growth assay of HCT.shPea3 and LS.shPea3 cells. 5 × 10⁶ cells were injected s.c. into the flanks of mice (8 per group) and calliper measurements of the tumours were taken. Shown are fold change in tumour sizes compared to day zero. Dotted horizontal line indicates 3-fold starting tumour size. aP < 0.05 vs final tumour measurements. Statistical analysis was performed using Student’s t-test for the final tumour measurements.
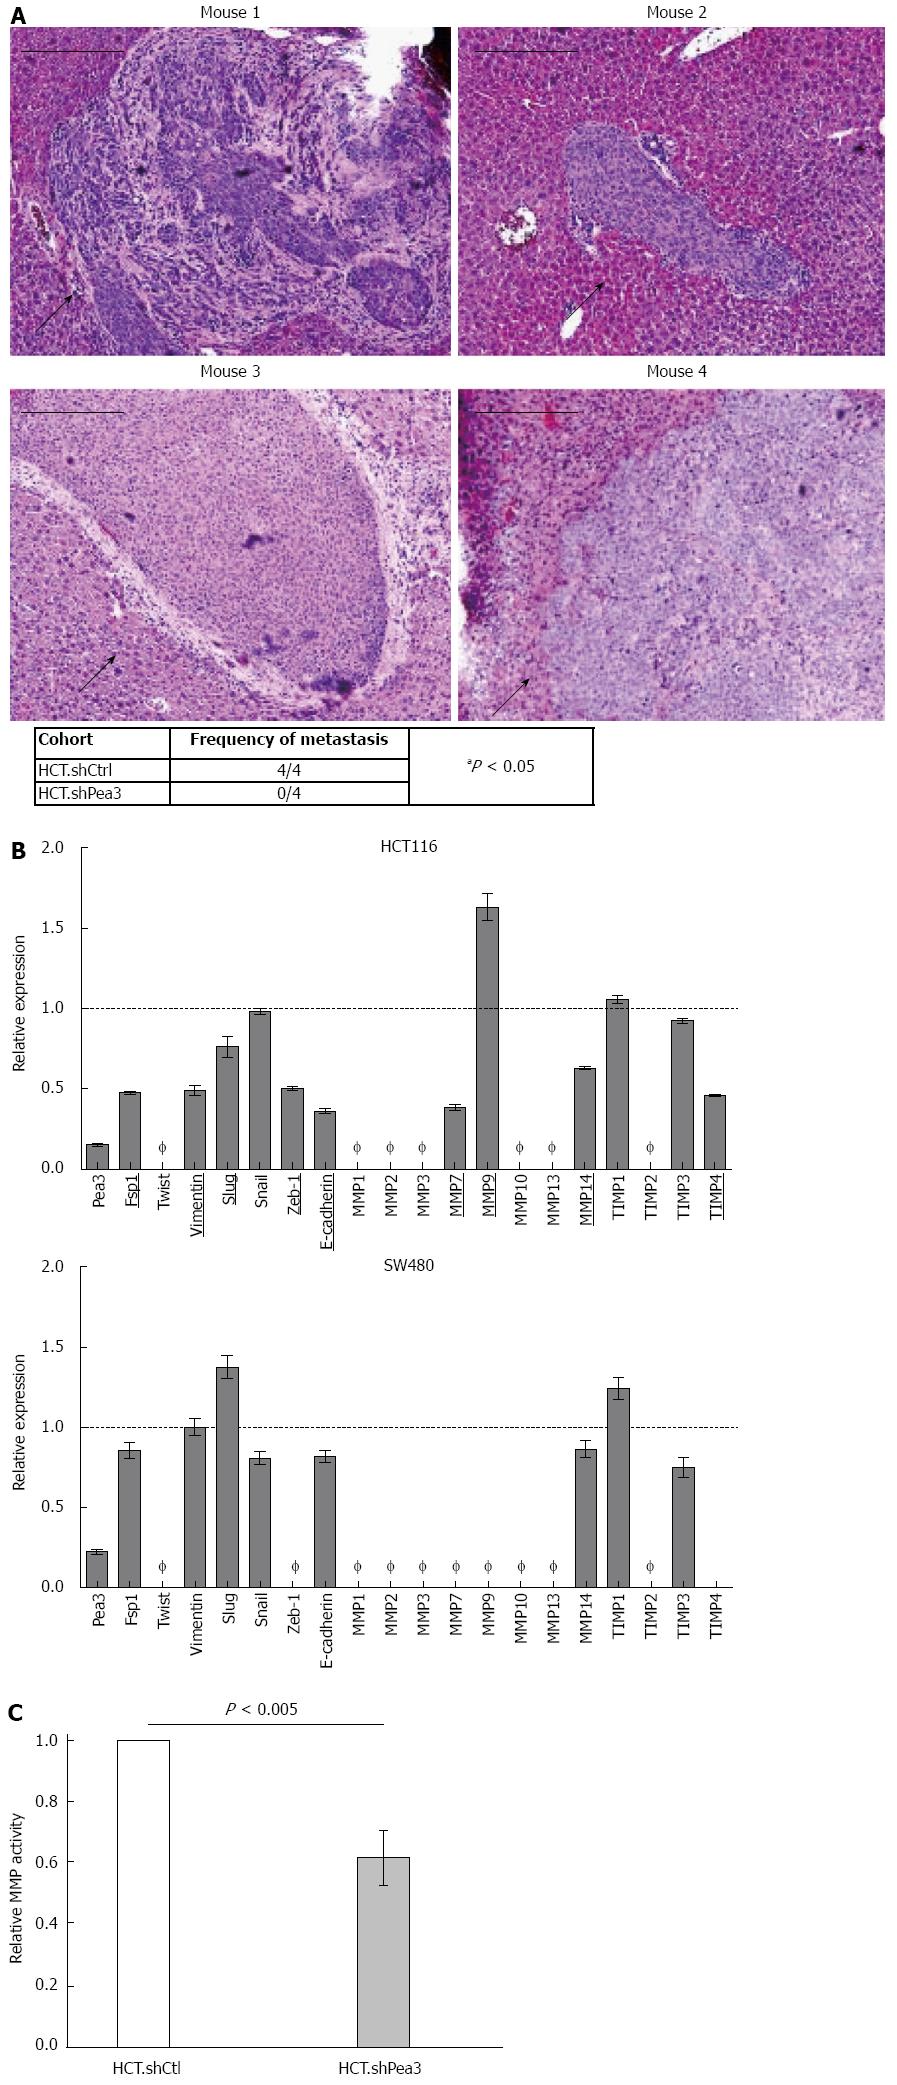
Figure 4 In vivo xenograft assay for the formation of liver metastases by HCT.
shPea3 cells, and differential expression of epithelial-mesenchymal transition markers and matrix metalloproteases. A: Ten million HCT cells were injected into spleens of athymic nude mice (4 per group), and livers were analyzed by immunohistochemistry (haematoxylin and eosin) at 21-d post injection. Representative images of metastases from the HCT.shCtrl cohort. Black arrows indicate the metastatic mass. Scale bar indicates 200 μm. Summary of the metastases observed in the shPea3 vs shCtrl cohort. Result of the χ2 test is shown; B: qPCR analysis of select epithelial-mesenchymal transition markers and a panel of MMP transcripts in HCT116 (top panel) or SW480 cells (bottom panel). Obtained ∆Ct values are normalized to GAPDH values, and expression is shown as fold change in Pea3 expression relative to cells expressing control shCtrl. Ø indicates expression is below detection threshold (Ct > 32 cycles). Targets that display differential expression between shPea3 and shCtrl consistently of at least 20% are underlined and bolded. Dashed horizontal line indicates the expression of the shCtrl cohort. Representative of three independent experiments; C: Results of the generic MMP activity assay, given as relative light units normalized to the amount of total protein in the sample. Data shown as fold change in MMP activity of HCT.shPea3 expressing cells relative to HCT.shCtrl. Representative of four independent experiments. MMP: Matrix metalloproteases.
- Citation: Mesci A, Taeb S, Huang X, Jairath R, Sivaloganathan D, Liu SK. Pea3 expression promotes the invasive and metastatic potential of colorectal carcinoma. World J Gastroenterol 2014; 20(46): 17376-17387
- URL: https://www.wjgnet.com/1007-9327/full/v20/i46/17376.htm
- DOI: https://dx.doi.org/10.3748/wjg.v20.i46.17376


