Copyright
©2014 Baishideng Publishing Group Inc.
World J Gastroenterol. Dec 7, 2014; 20(45): 17206-17217
Published online Dec 7, 2014. doi: 10.3748/wjg.v20.i45.17206
Published online Dec 7, 2014. doi: 10.3748/wjg.v20.i45.17206
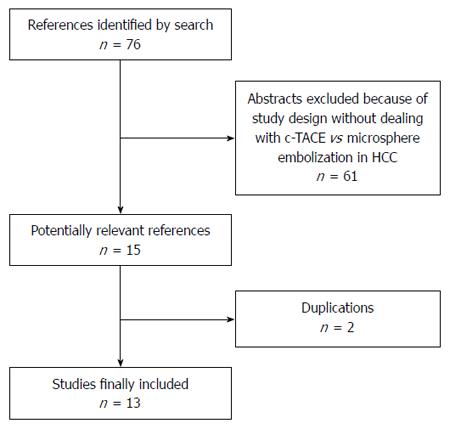
Figure 1 Flow chart of search strategy for study inclusion.
c-TACE: Conventional transarterial chemoembolization; HCC: Hepatocellular carcinoma.
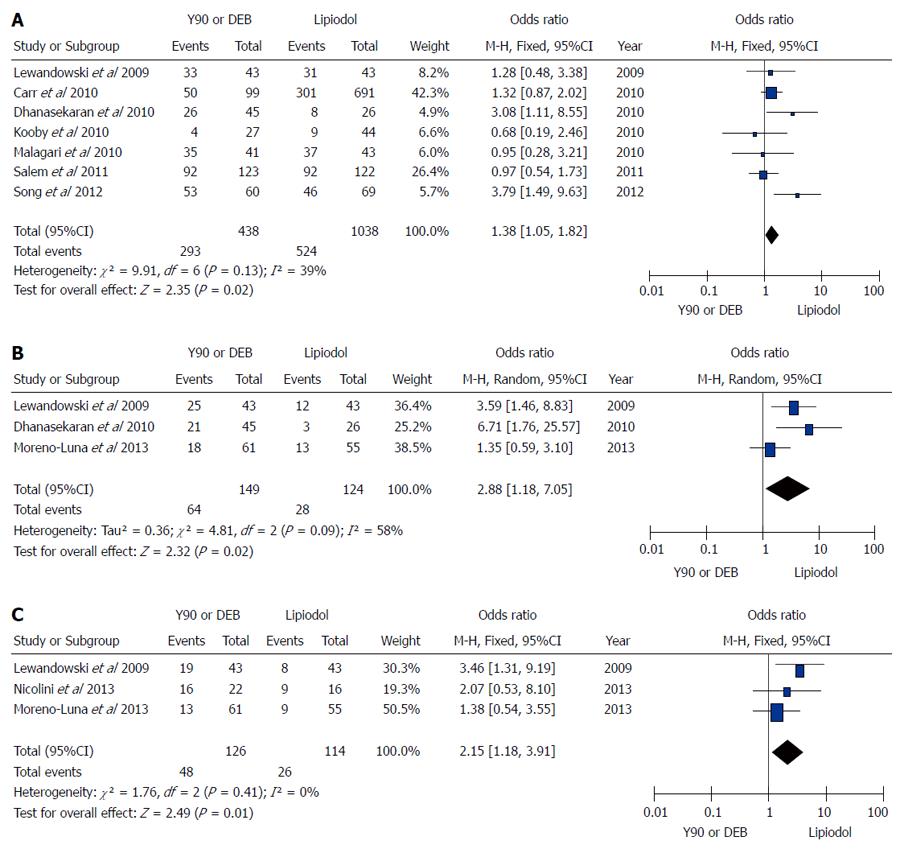
Figure 2 Microsphere embolization (90Y or DEB) vs conventional transarterial chemoembolization for treatment of patients with hepatocellular carcinoma in terms of overall survival rates.
A: Meta-analysis of 1-year results; B: Meta-analysis of 2-year results; C: Meta-analysis of 3-year results. M-H: Mantel-Haenszel.
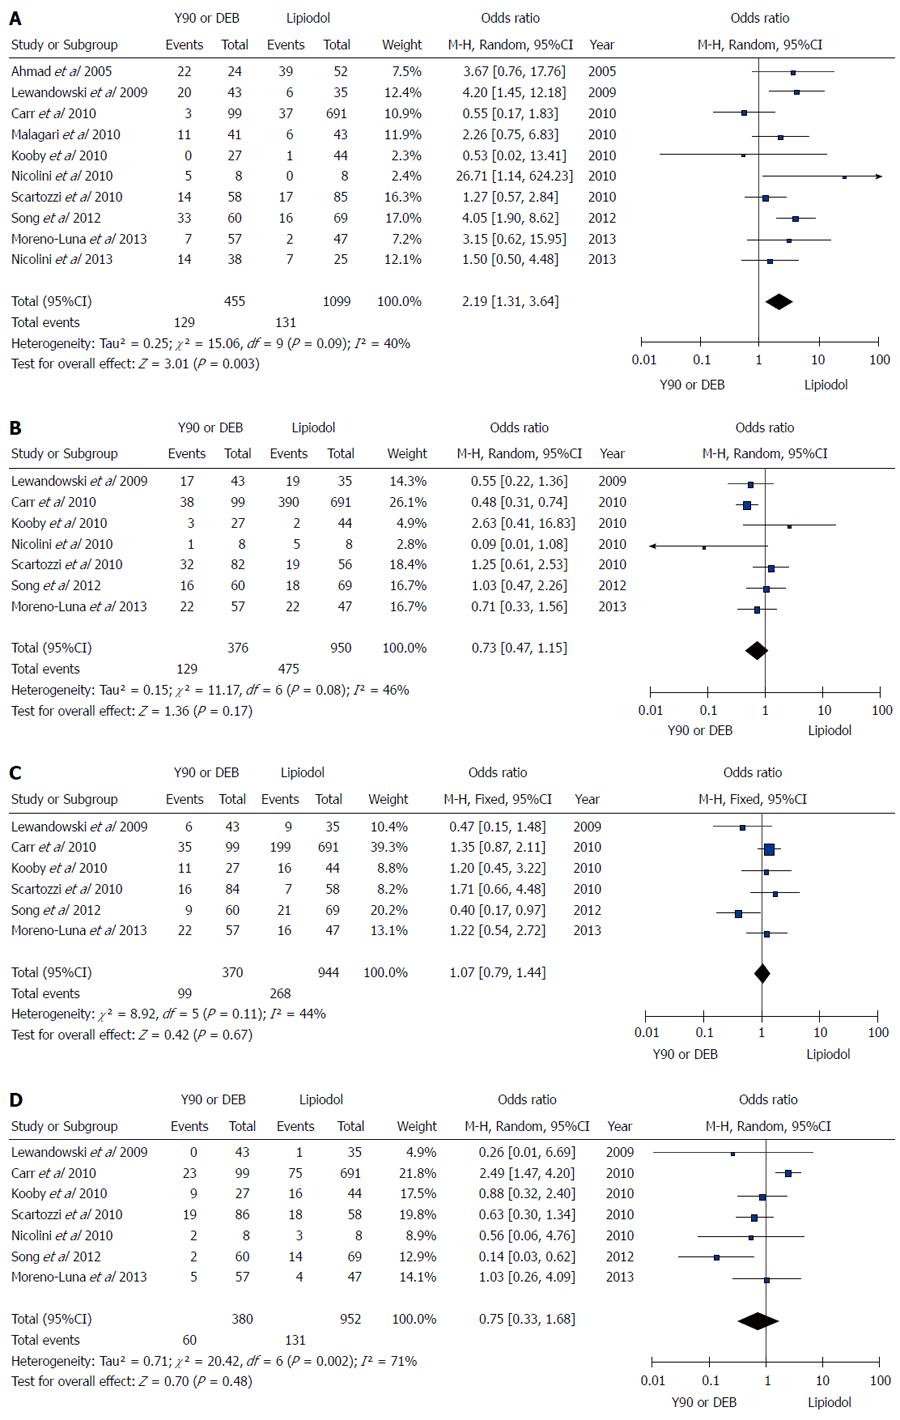
Figure 3 Microspheres embolization (90Y or DEB) vs conventional transarterial chemoembolization for treatment of patients with hepatocellular carcinoma in terms of tumor response.
A: Meta-analysis of complete response results; B: Meta-analysis of partial response results; C: Meta-analysis of stable disease results; D: Meta-analysis of progressive disease results.
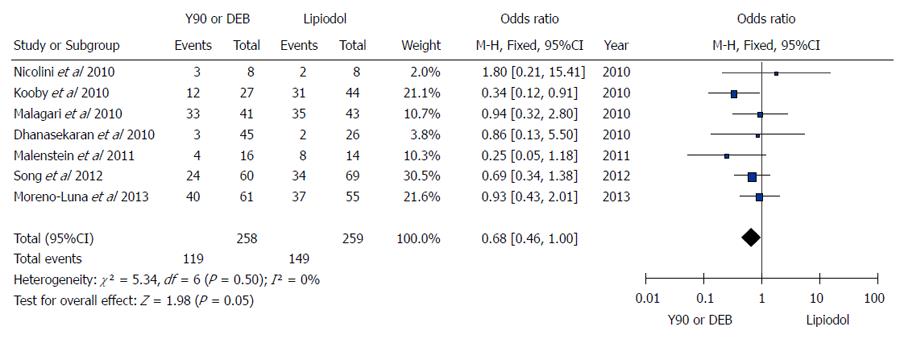
Figure 4 Microsphere embolization (90Y or DEB) vs compare conventional transarterial chemoembolization for treatment of patients with hepatocellular carcinoma in term of α-fetoprotein response.
Figure 5 Microsphere embolization (90Y or DEB) vs conventional transarterial chemoembolization for treatment of patients with hepatocellular carcinoma in terms of tumor progression rate.
Figure 6 Microsphere embolization (90Y or DEB) vs conventional transarterial chemoembolization for treatment of patients with hepatocellular carcinoma in terms of complications.
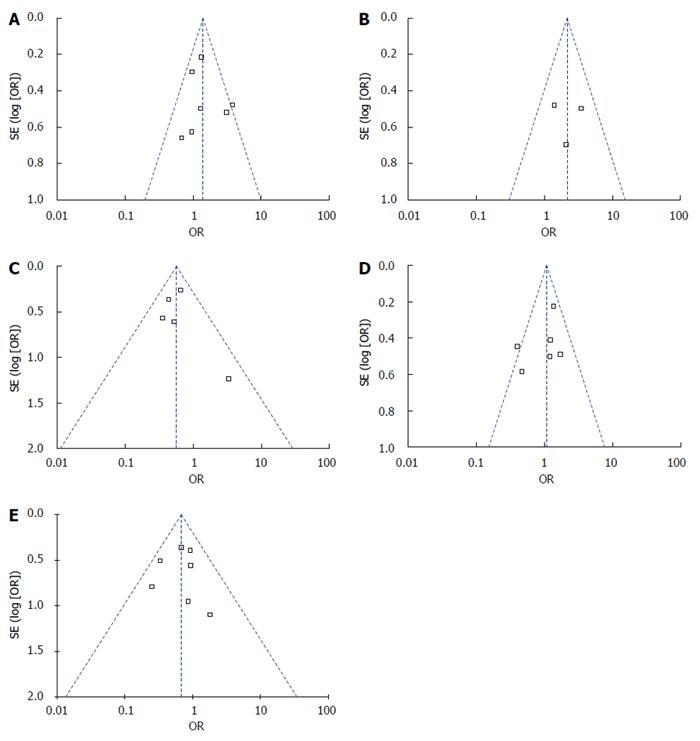
Figure 7 Funnel plots in this study.
A: Funnel plot of 1-year overall survival rate; B: Funnel plot of 3-year recurrence-free survival rate; C: Funnel plot of tumor progression rate; D: Funnel plot of stable disease; E: Funnel plot of complications.
-
Citation: Ni JY, Xu LF, Wang WD, Sun HL, Chen YT. Conventional transarterial chemoembolization
vs microsphere embolization in hepatocellular carcinoma: A meta-analysis. World J Gastroenterol 2014; 20(45): 17206-17217 - URL: https://www.wjgnet.com/1007-9327/full/v20/i45/17206.htm
- DOI: https://dx.doi.org/10.3748/wjg.v20.i45.17206


