Copyright
©2014 Baishideng Publishing Group Inc.
World J Gastroenterol. Dec 7, 2014; 20(45): 17190-17195
Published online Dec 7, 2014. doi: 10.3748/wjg.v20.i45.17190
Published online Dec 7, 2014. doi: 10.3748/wjg.v20.i45.17190
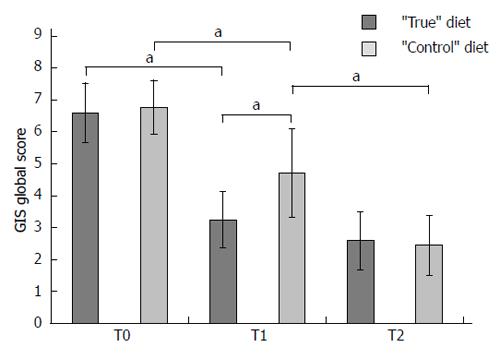
Figure 1 Histogram compares the mean global GIS scores obtained in “true” diet group and control diet group at T0 (baseline), T1 (one month after receiving the diet) and T2 (three months after receiving the diet for “true” diet group, two months after the “diet switch” for the control group).
Error bars indicate the standard deviation. aP < 0.05 “true” diet vs“control” diet.
- Citation: Caselli M, Zuliani G, Cassol F, Fusetti N, Zeni E, Lo Cascio N, Soavi C, Gullini S. Test-based exclusion diets in gastro-esophageal reflux disease patients: A randomized controlled pilot trial. World J Gastroenterol 2014; 20(45): 17190-17195
- URL: https://www.wjgnet.com/1007-9327/full/v20/i45/17190.htm
- DOI: https://dx.doi.org/10.3748/wjg.v20.i45.17190


