Copyright
©2014 Baishideng Publishing Group Inc.
World J Gastroenterol. Dec 7, 2014; 20(45): 17107-17114
Published online Dec 7, 2014. doi: 10.3748/wjg.v20.i45.17107
Published online Dec 7, 2014. doi: 10.3748/wjg.v20.i45.17107
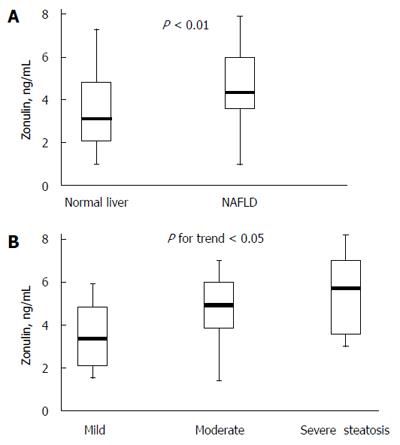
Figure 1 Zonulin levels for obese children.
A: Zonulin levels for obese children with and without nonalcoholic fatty liver disease (NAFLD). Box-plots give the median value (black), 25th and 75th percentiles (lower and upper limits of the box), and lower and upper adjacent values (whiskers); B: Zonulin levels for obese children with NAFLD according to severity of steatosis (mild, 10; moderate, 17; severe, 13 patients). Box-plots give the median value (black), 25th and 75th percentiles (lower and upper limits of the box), and lower and upper adjacent values (whiskers).
- Citation: Pacifico L, Bonci E, Marandola L, Romaggioli S, Bascetta S, Chiesa C. Increased circulating zonulin in children with biopsy-proven nonalcoholic fatty liver disease. World J Gastroenterol 2014; 20(45): 17107-17114
- URL: https://www.wjgnet.com/1007-9327/full/v20/i45/17107.htm
- DOI: https://dx.doi.org/10.3748/wjg.v20.i45.17107


