Copyright
©2014 Baishideng Publishing Group Inc.
World J Gastroenterol. Dec 7, 2014; 20(45): 16964-16975
Published online Dec 7, 2014. doi: 10.3748/wjg.v20.i45.16964
Published online Dec 7, 2014. doi: 10.3748/wjg.v20.i45.16964
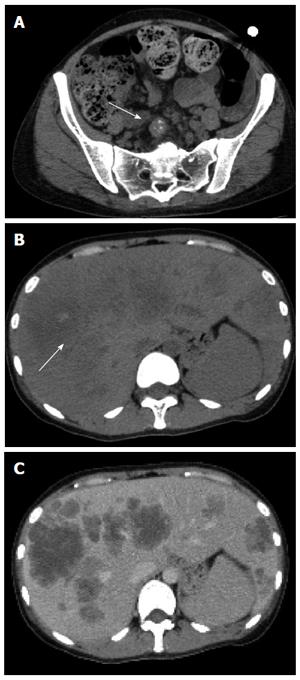
Figure 1 Thirty year-old female with liver metastases from colorectal cancer.
A: Contrast-enhanced CT scan image. A lymph node metastasis often appears with calcifications, and CT is superior to detect these calcifications; B: Plain CT image. Arrow shows calcification of the tumor. Calcification is often seen in liver metastases; C: Contrast-enhanced CT scan image. Calcification is difficult to detect on contrast-enhanced CT. CT: Computed tomography.
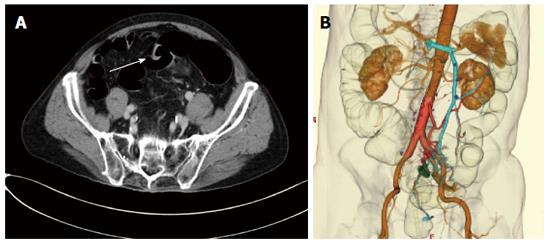
Figure 2 Eighty year-old male with liver metastases from colorectal cancer.
A: Axial image shows a sigmoid cancer. It is depicted as square-like wall deformity (arrow); B: Three-dimensional CT imaging shows the feeding artery and draining vein. The left colic and sigmoid arteries become clear from the aortic root. CT: Computed tomography.
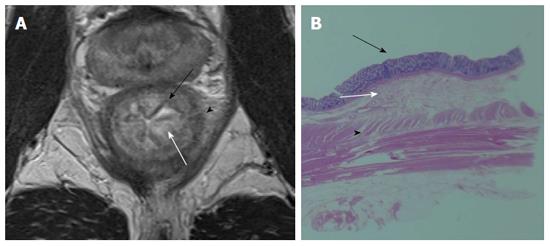
Figure 3 Mucosa is visualized by low signal intensity (black arrow), submucosa by high intensity (white arrow), and muscularis propria by low intensity (arrow head) on T2-weighted image (A) and pathological correlation between the resected specimen and magnetic resonance imaging (B).
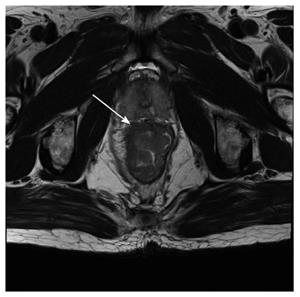
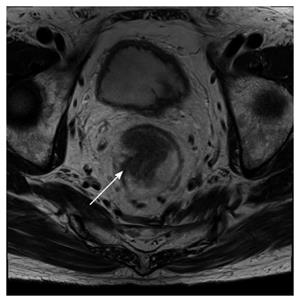
Figure 4 Fifty-eight-year-old male with a pathologically-confirmed T3 tumor.
T2-weighted image demonstrates that the tumor invaded beyond the muscularis propria (arrow).
Figure 5 Seventy-four-year-old male with a pathologically-confirmed T2 tumor.
It is difficult to differentiate fibrosis from tumor infiltration beyond the muscularis propria (arrow).
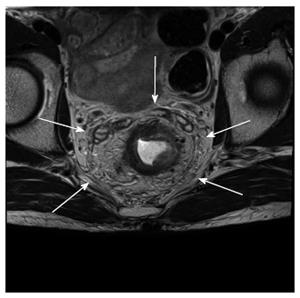
Figure 6 Sixty-two-year-old male with rectal cancer.
The circumferential resection margin. Mesorectal fascia is visualized as a linear low signal intensity on T2-weighted imaging.
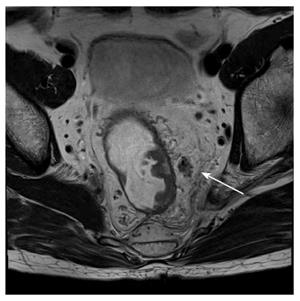
Figure 7 Sixty-three-year-old male with a metastatic lymph node.
T2-weighted image demonstrates an ill-defined and mixed intensity pararectal lymph node.
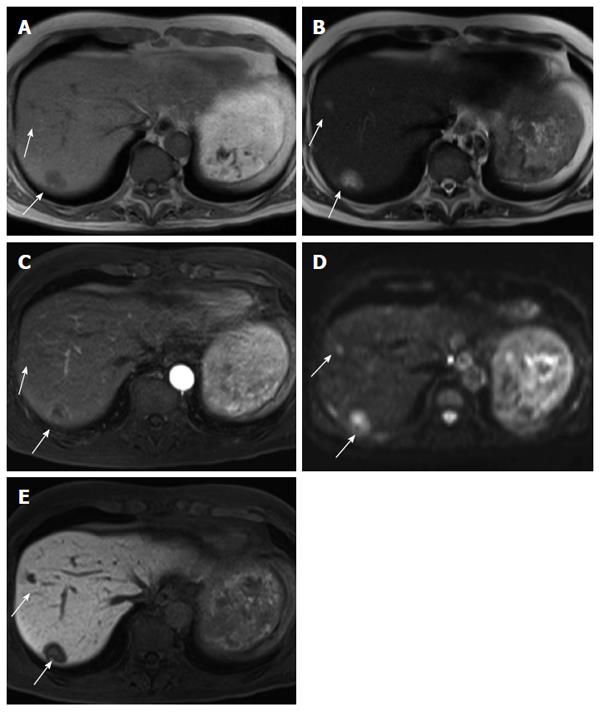
Figure 8 Sixty-four-year-old male with liver metastases (arrows).
A: Liver metastases show low intensity on T1-weighted image; B: Intermediate intensity on T2-weighted image; C: Marginal enhancement on early phase fat-suppressed T1-weighted image; D: High intensity on diffusion-weighted image; E: Low intensity on the hepatocyte-specific phase of gadolinium ethoxybenzyl diethlenetriamine pentaacetic acid-enhanced fat-saturated T1-weighted image.
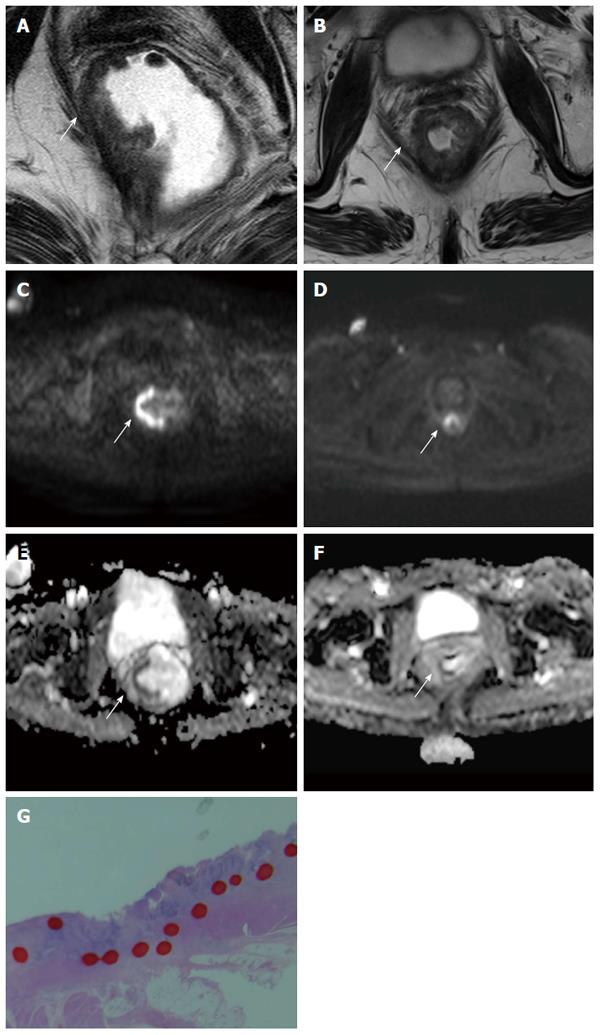
Figure 9 Seventy-one-year old female with advanced rectal cancer.
From (A) to (B), T2-weighted images show changes before and after chemo-radiation therapy. From (C) to (D), diffusion-weighted images show changes before and after chemo-radiation therapy. From (E) to (F), apparent diffusion coefficient maps show changes before and after chemo-radiation therapy. Tumor cell viability is visualized by diffusion-weighted images and apparent diffusion coefficient maps (arrow). The apparent diffusion coefficient value decreased obviously. This lesion pathologically confirmed remaining cancer cells. The apparent diffusion coefficient value is good indicator of cell viability; G: Area surrounded by the red dotted line confirmed remaining cancer cells in this patient.
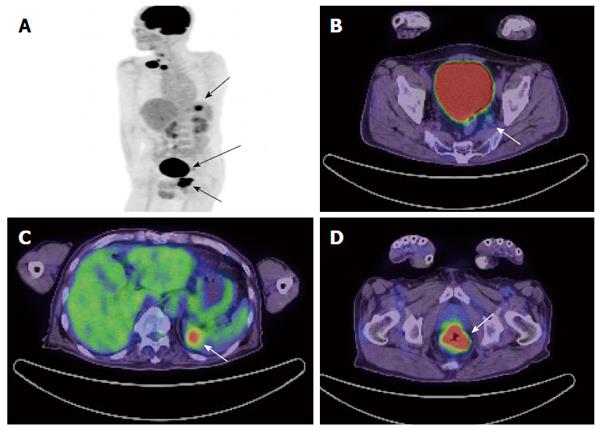
Figure 10 Sixty-four-year-old male with metastatic rectal cancer.
A: Maximum intensity projection image of PET shows the primary rectal lesion, metastasis of lateral lymph node and metastasis of spleen (arrow); B: PET/CT axial image shows a pathologically-confirmed metastasis of lateral lymph node with a SUVmax = 2.2 and diameter of 8 mm (arrow); C: PET/CT axial image shows metastasis of spleen (arrow); D: PET/CT axial image show primary rectal lesion (arrow). PET: Positron emission tomography; CT: Computed tomography; SUV: Standardized uptake value.
- Citation: Kijima S, Sasaki T, Nagata K, Utano K, Lefor AT, Sugimoto H. Preoperative evaluation of colorectal cancer using CT colonography, MRI, and PET/CT. World J Gastroenterol 2014; 20(45): 16964-16975
- URL: https://www.wjgnet.com/1007-9327/full/v20/i45/16964.htm
- DOI: https://dx.doi.org/10.3748/wjg.v20.i45.16964


