Copyright
©2014 Baishideng Publishing Group Inc.
World J Gastroenterol. Nov 28, 2014; 20(44): 16683-16689
Published online Nov 28, 2014. doi: 10.3748/wjg.v20.i44.16683
Published online Nov 28, 2014. doi: 10.3748/wjg.v20.i44.16683
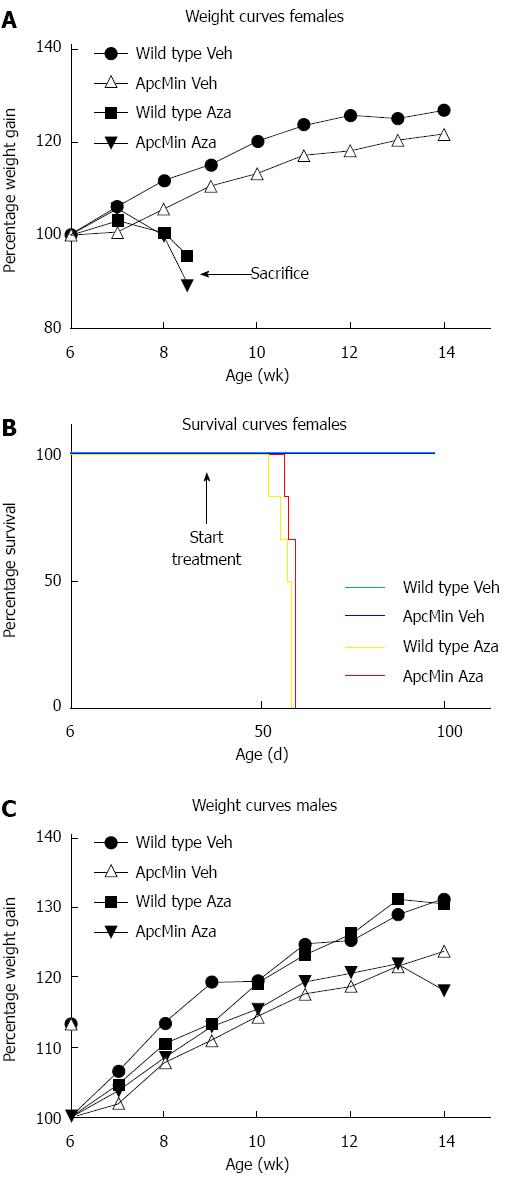
Figure 1 Treatment with azathioprine results in severe drug associated toxicity.
A: Weight curve of female mice. All azathioprine treated female mice had to be sacrificed three to four weeks after start of the treatment due to progressive weight loss; B: Survival curve of female mice; C: Weight curve of male mice. After 9 to 10 wk of treatment male mice started to show signs of toxicity. Veh: Vehicle; Aza: Azathioprine.
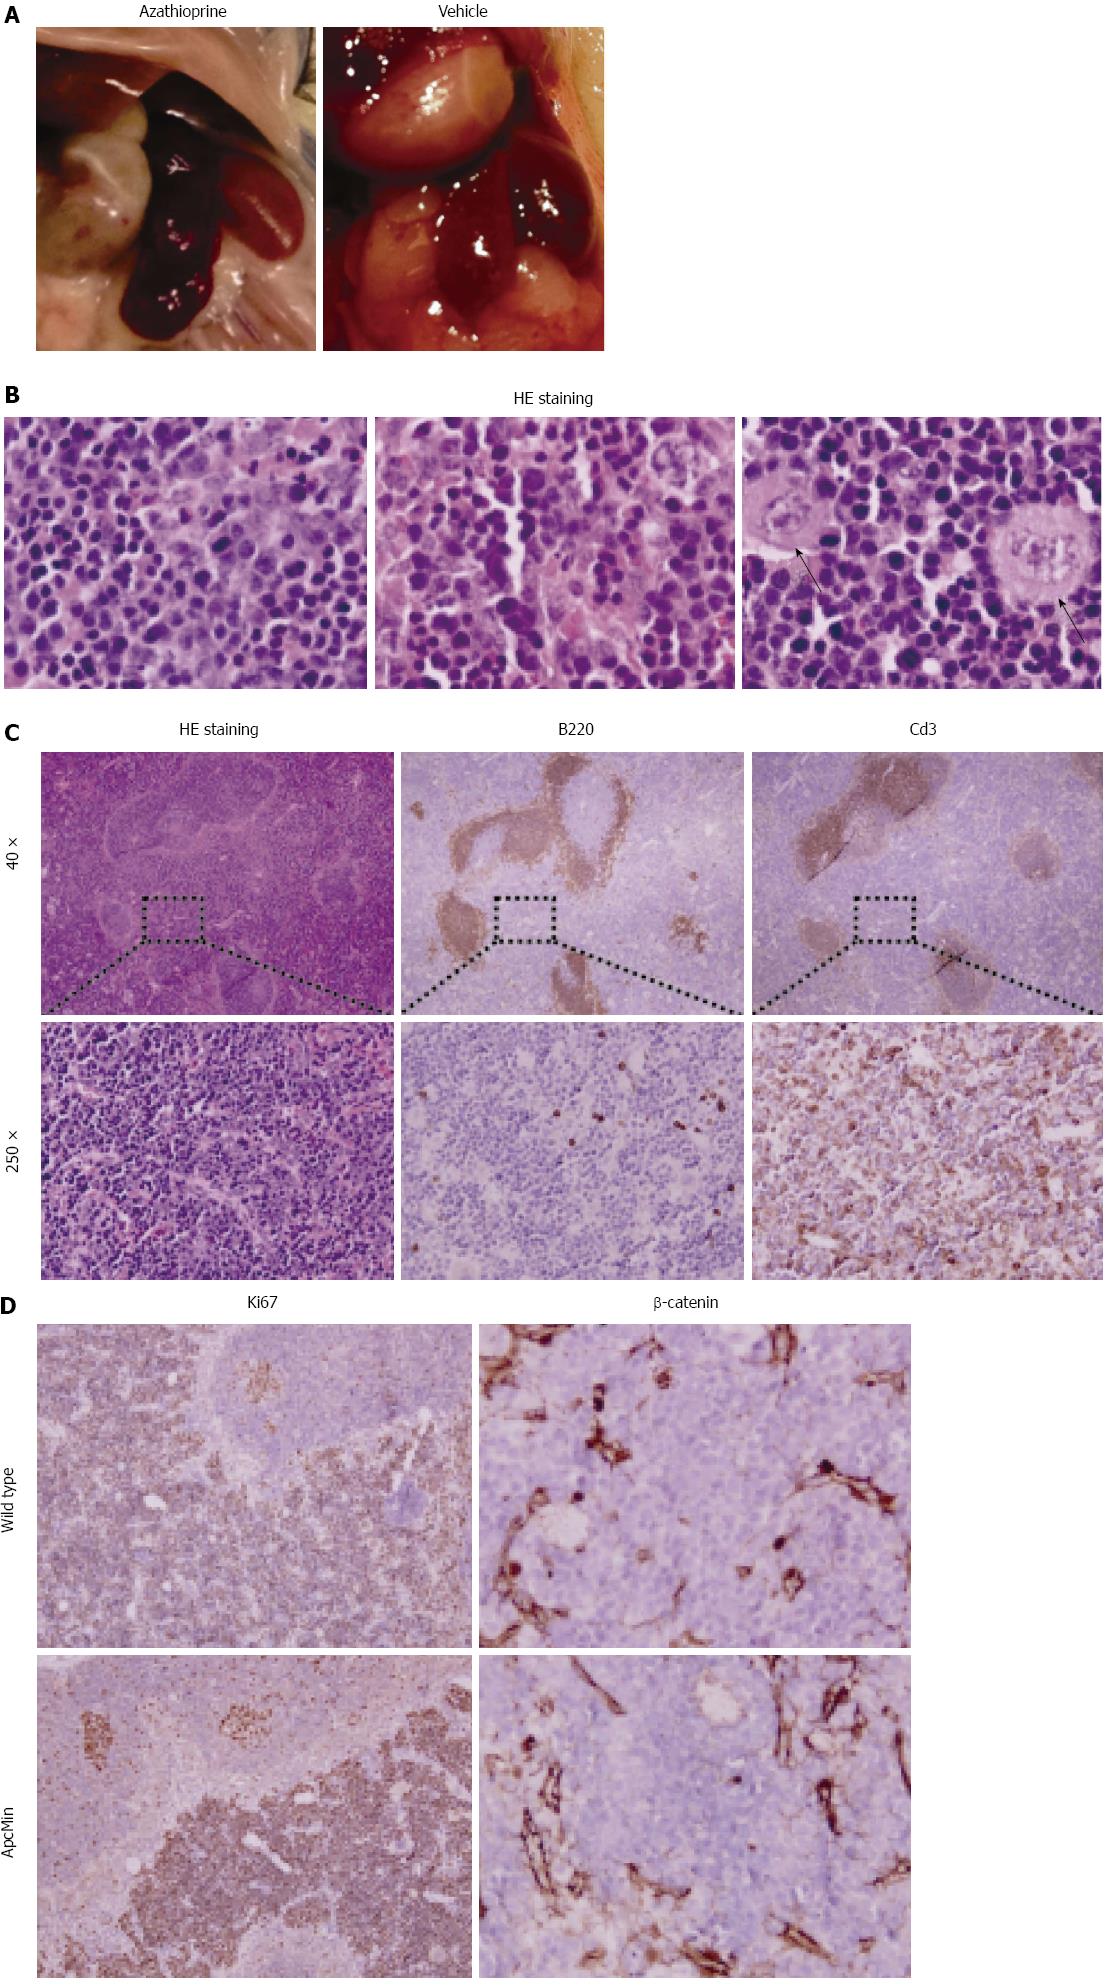
Figure 2 Azathioprine treatment results in the development of splenic T cell lymphomas.
A: Representative image of vehicle and azathioprine treated mice showing splenic enlargement and discolored liver and kidneys in azathioprine treated animals; B: Representative photomicrographs of the morphology of the splenic infiltrates. The images show a highly atypical and pleomorphic population of lymphocytic blast-like cells with prominent variation in nuclear size and contour (left panel), atypical mitoses (middle panel, top right) and admixed giant cells (right panel); C: Splenic architecture. Peri-arteriolar B and T cell areas are preserved (B220 and Cd3 top panel), while the red pulpa is effaced by a Cd3 positive atypical infiltrate, diagnostic of T-cell lymphoma; D: Ki67 staining shows limited proliferative activity in pre-existent germinal centers; the surrounding atypical infiltrate demonstrates a nearly 100% labeling index. β-catenin does not show nuclear labeling in either genotype.
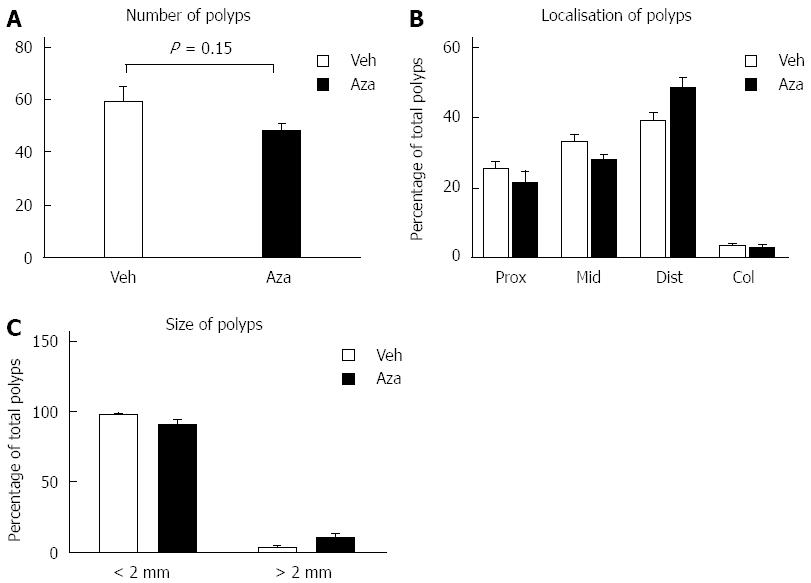
Figure 3 Azathioprine treatment does not affect adenoma development in ApcMin/+ mice.
Total adenoma number in azathioprine (n = 6) and vehicle treated (n = 6) mice (A). Localization (B) and size (C) of adenomas did not differ between vehicle and azathioprine treated mice. Veh: Vehicle; Aza: Azathioprine.
- Citation: Wielenga MC, Jeude JFVL, Rosekrans SL, Levin AD, Schukking M, D’Haens GR, Heijmans J, Jansen M, Muncan V, Brink GRVD. Azathioprine does not reduce adenoma formation in a mouse model of sporadic intestinal tumorigenesis. World J Gastroenterol 2014; 20(44): 16683-16689
- URL: https://www.wjgnet.com/1007-9327/full/v20/i44/16683.htm
- DOI: https://dx.doi.org/10.3748/wjg.v20.i44.16683


