Copyright
©2014 Baishideng Publishing Group Inc.
World J Gastroenterol. Nov 28, 2014; 20(44): 16674-16682
Published online Nov 28, 2014. doi: 10.3748/wjg.v20.i44.16674
Published online Nov 28, 2014. doi: 10.3748/wjg.v20.i44.16674
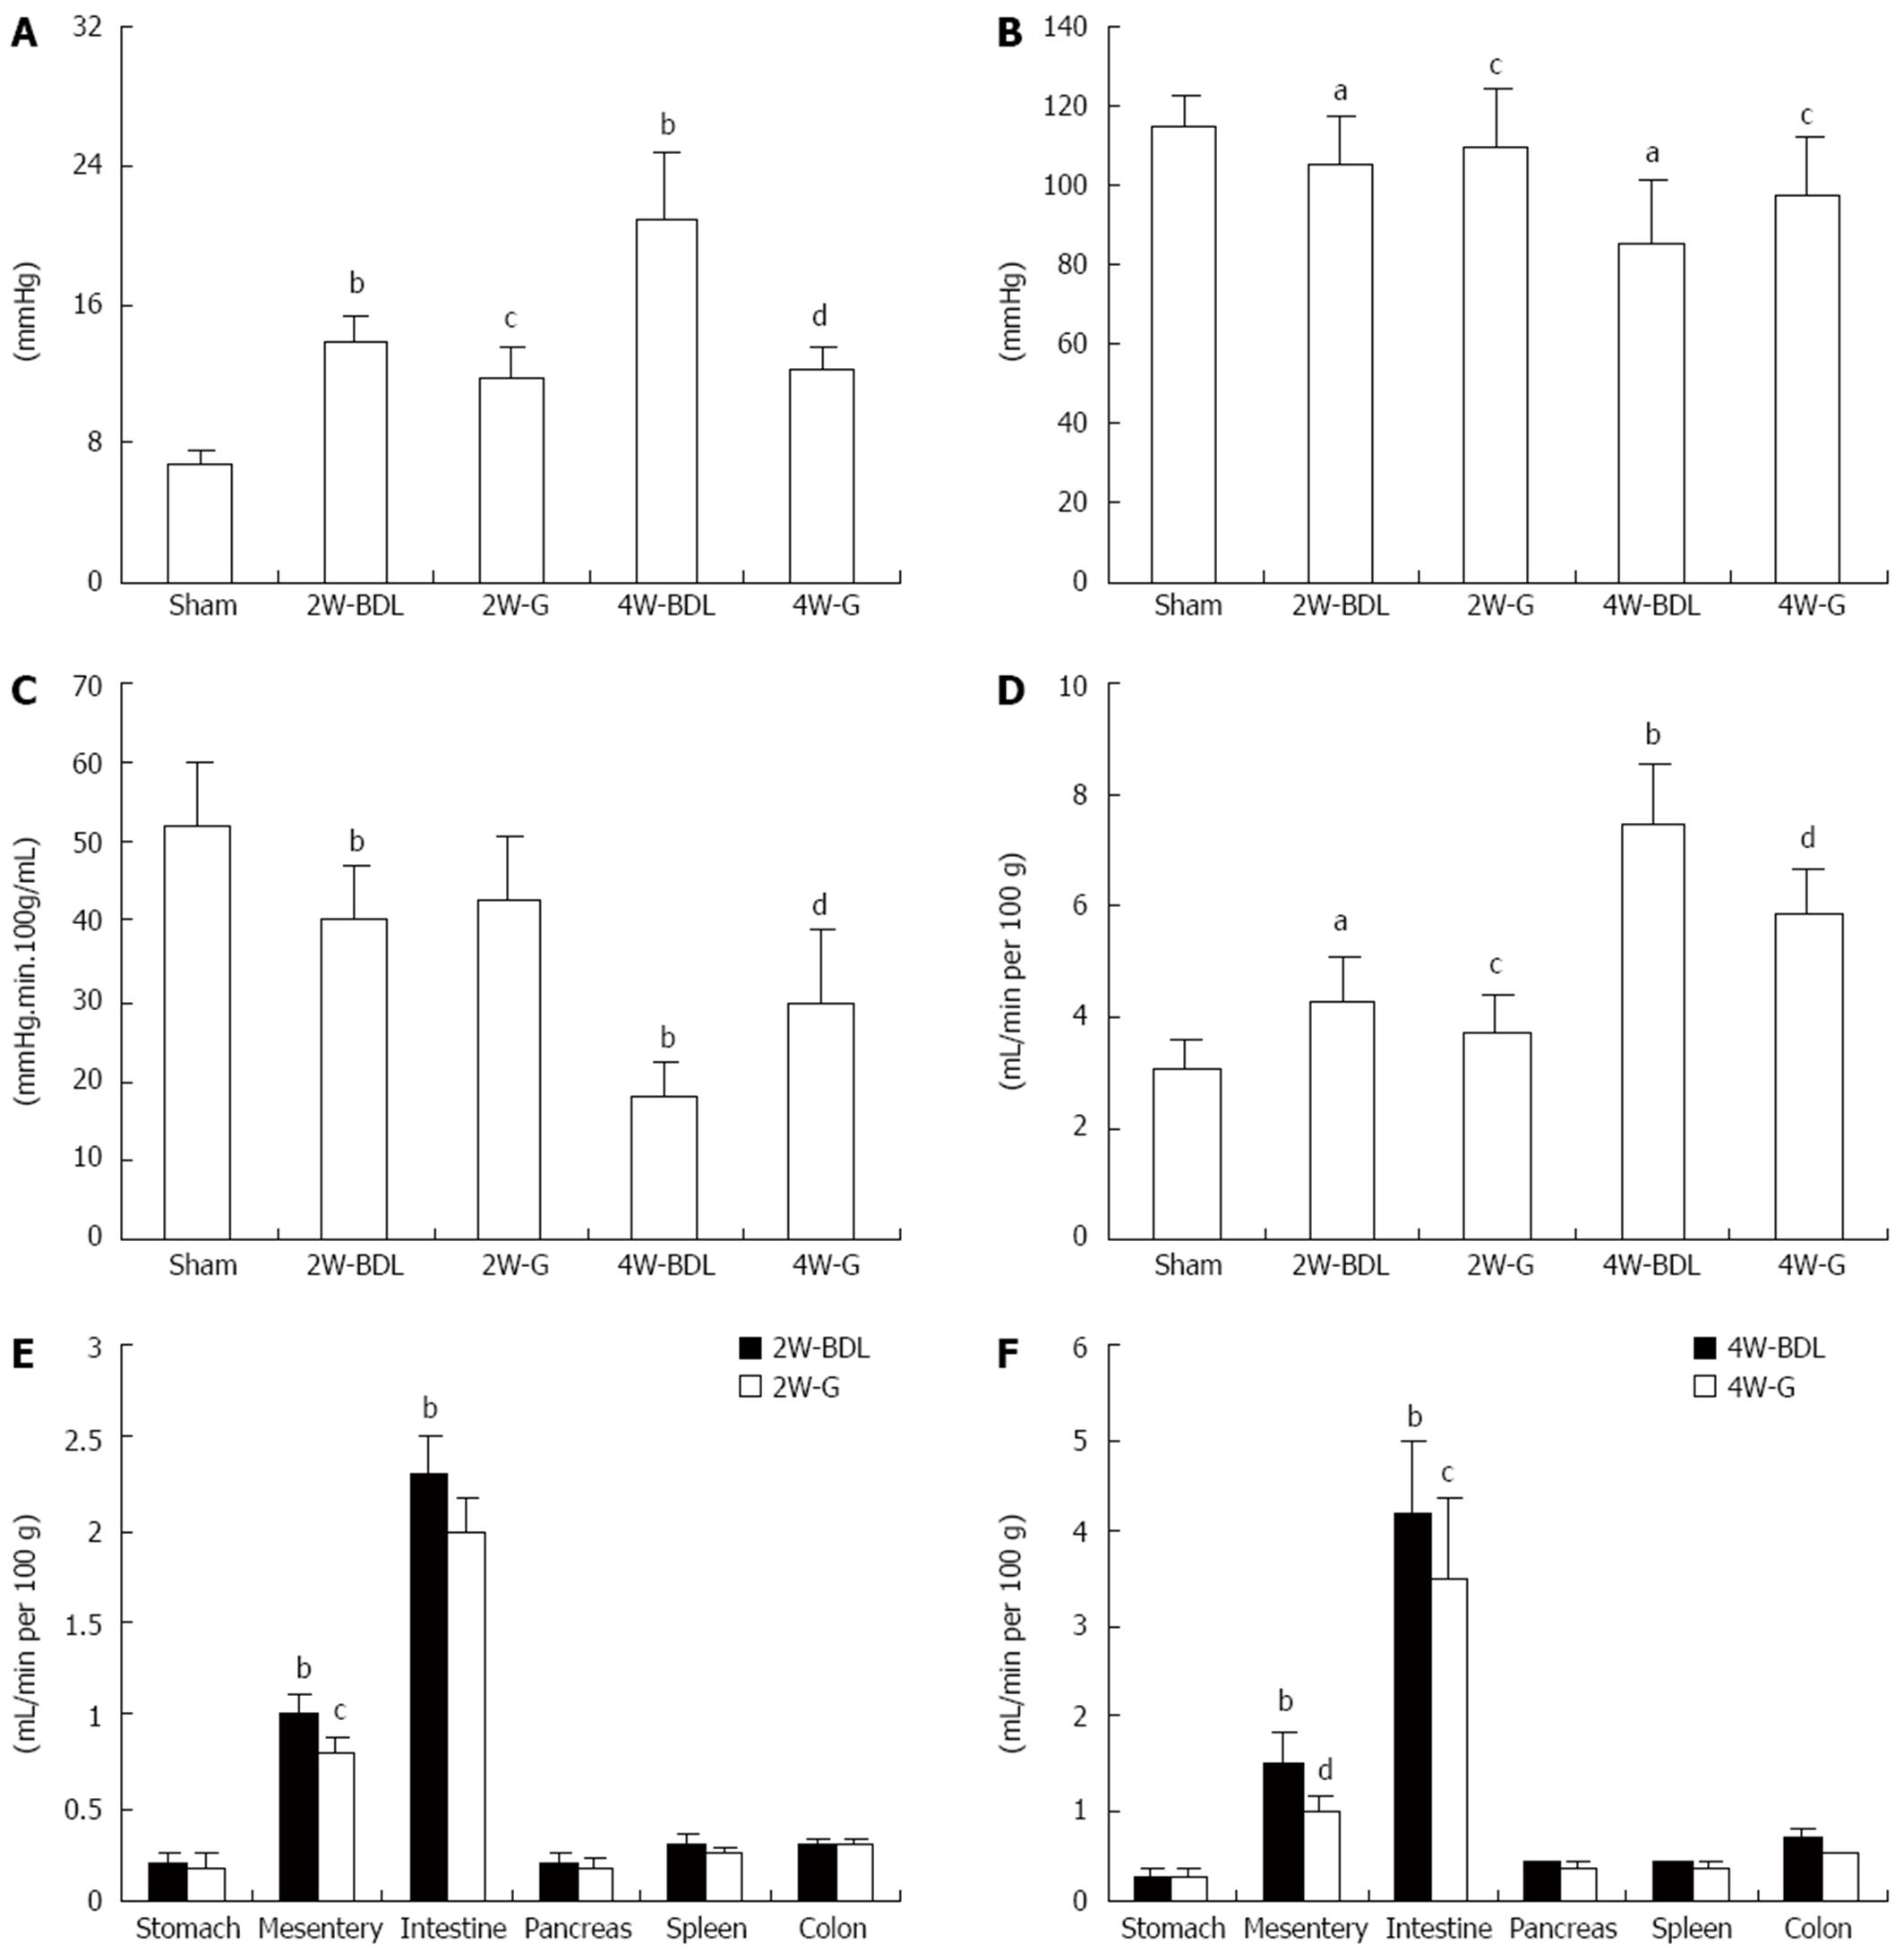
Figure 1 Effect of Glytan on splanchnic hemodynamics.
A: Effect of Glytan on portal pressure; B: Effect of Glytan on mean arterial pressure; C: Effect of Glytan on splanchnic vascular resistance; D: Effect of Glytan on portal territory blood flow; E: Effect of Glytan on the blood flow of splanchnic organs at 2 wk; F: Effect of Glytan on the blood flow of splanchnic organs at 4 wk. Results are from experiments on seven sham-operated rats and seven bile duct ligation (BDL) rats. Mean ± SEM values are shown. aP < 0.05, bP < 0.01, BDL rats vs sham-operated rats; cP < 0.05, dP < 0.01, rats in the Glytan group vs BDL rats. G: Glytan.
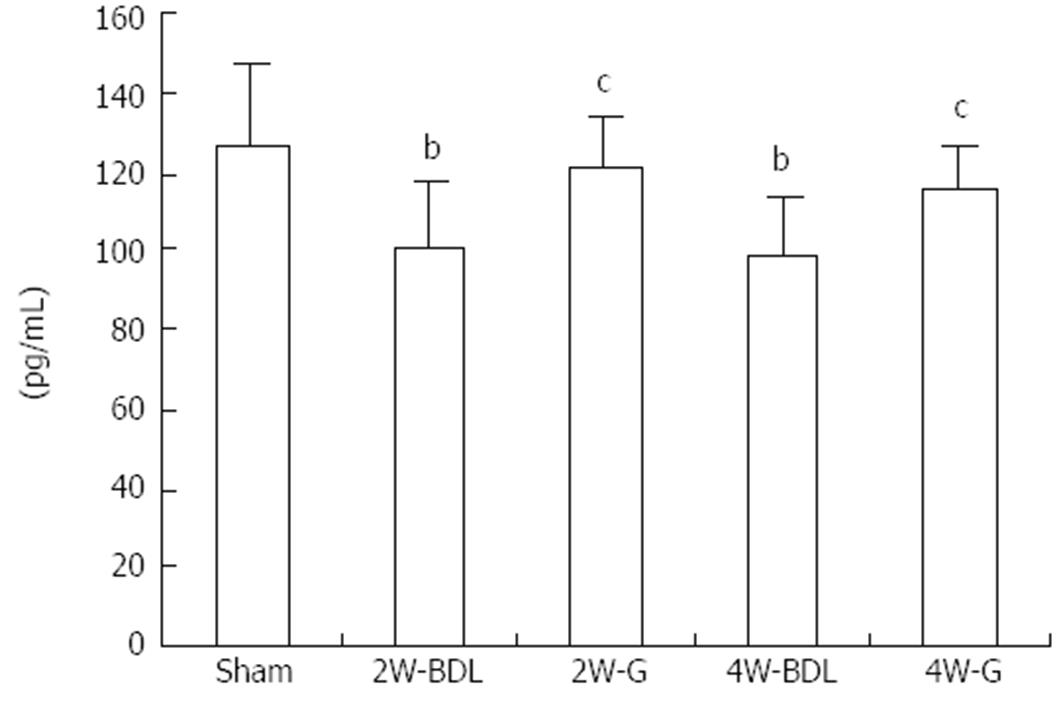
Figure 2 Effect of Glytan on ET-1 levels in the mesenteric circulation.
The results are from experiments on seven sham-operated rats and seven bile duct ligation (BDL) rats Mean ± SEM values are shown. bP < 0.01, BDL rats vs sham-operated rats; cP < 0.05, rats in the Glytan group vs BDL rats.
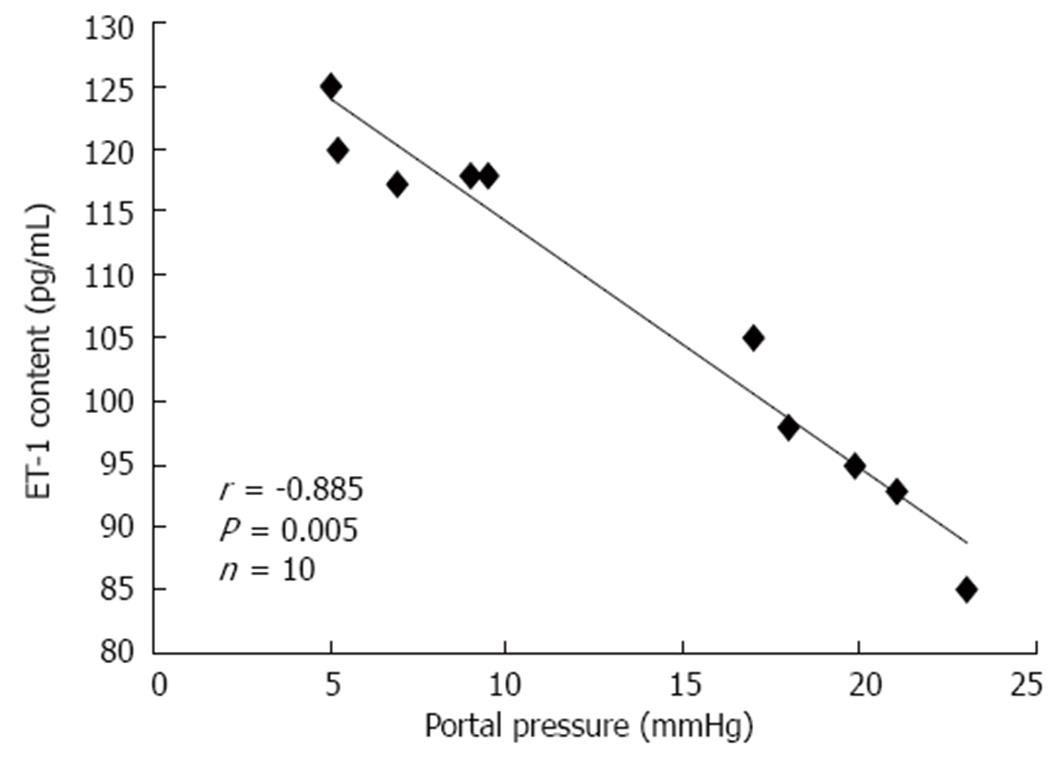
Figure 3 Correlation between portal pressure and ET-1 levels in the mesenteric circulation at 4 wk.
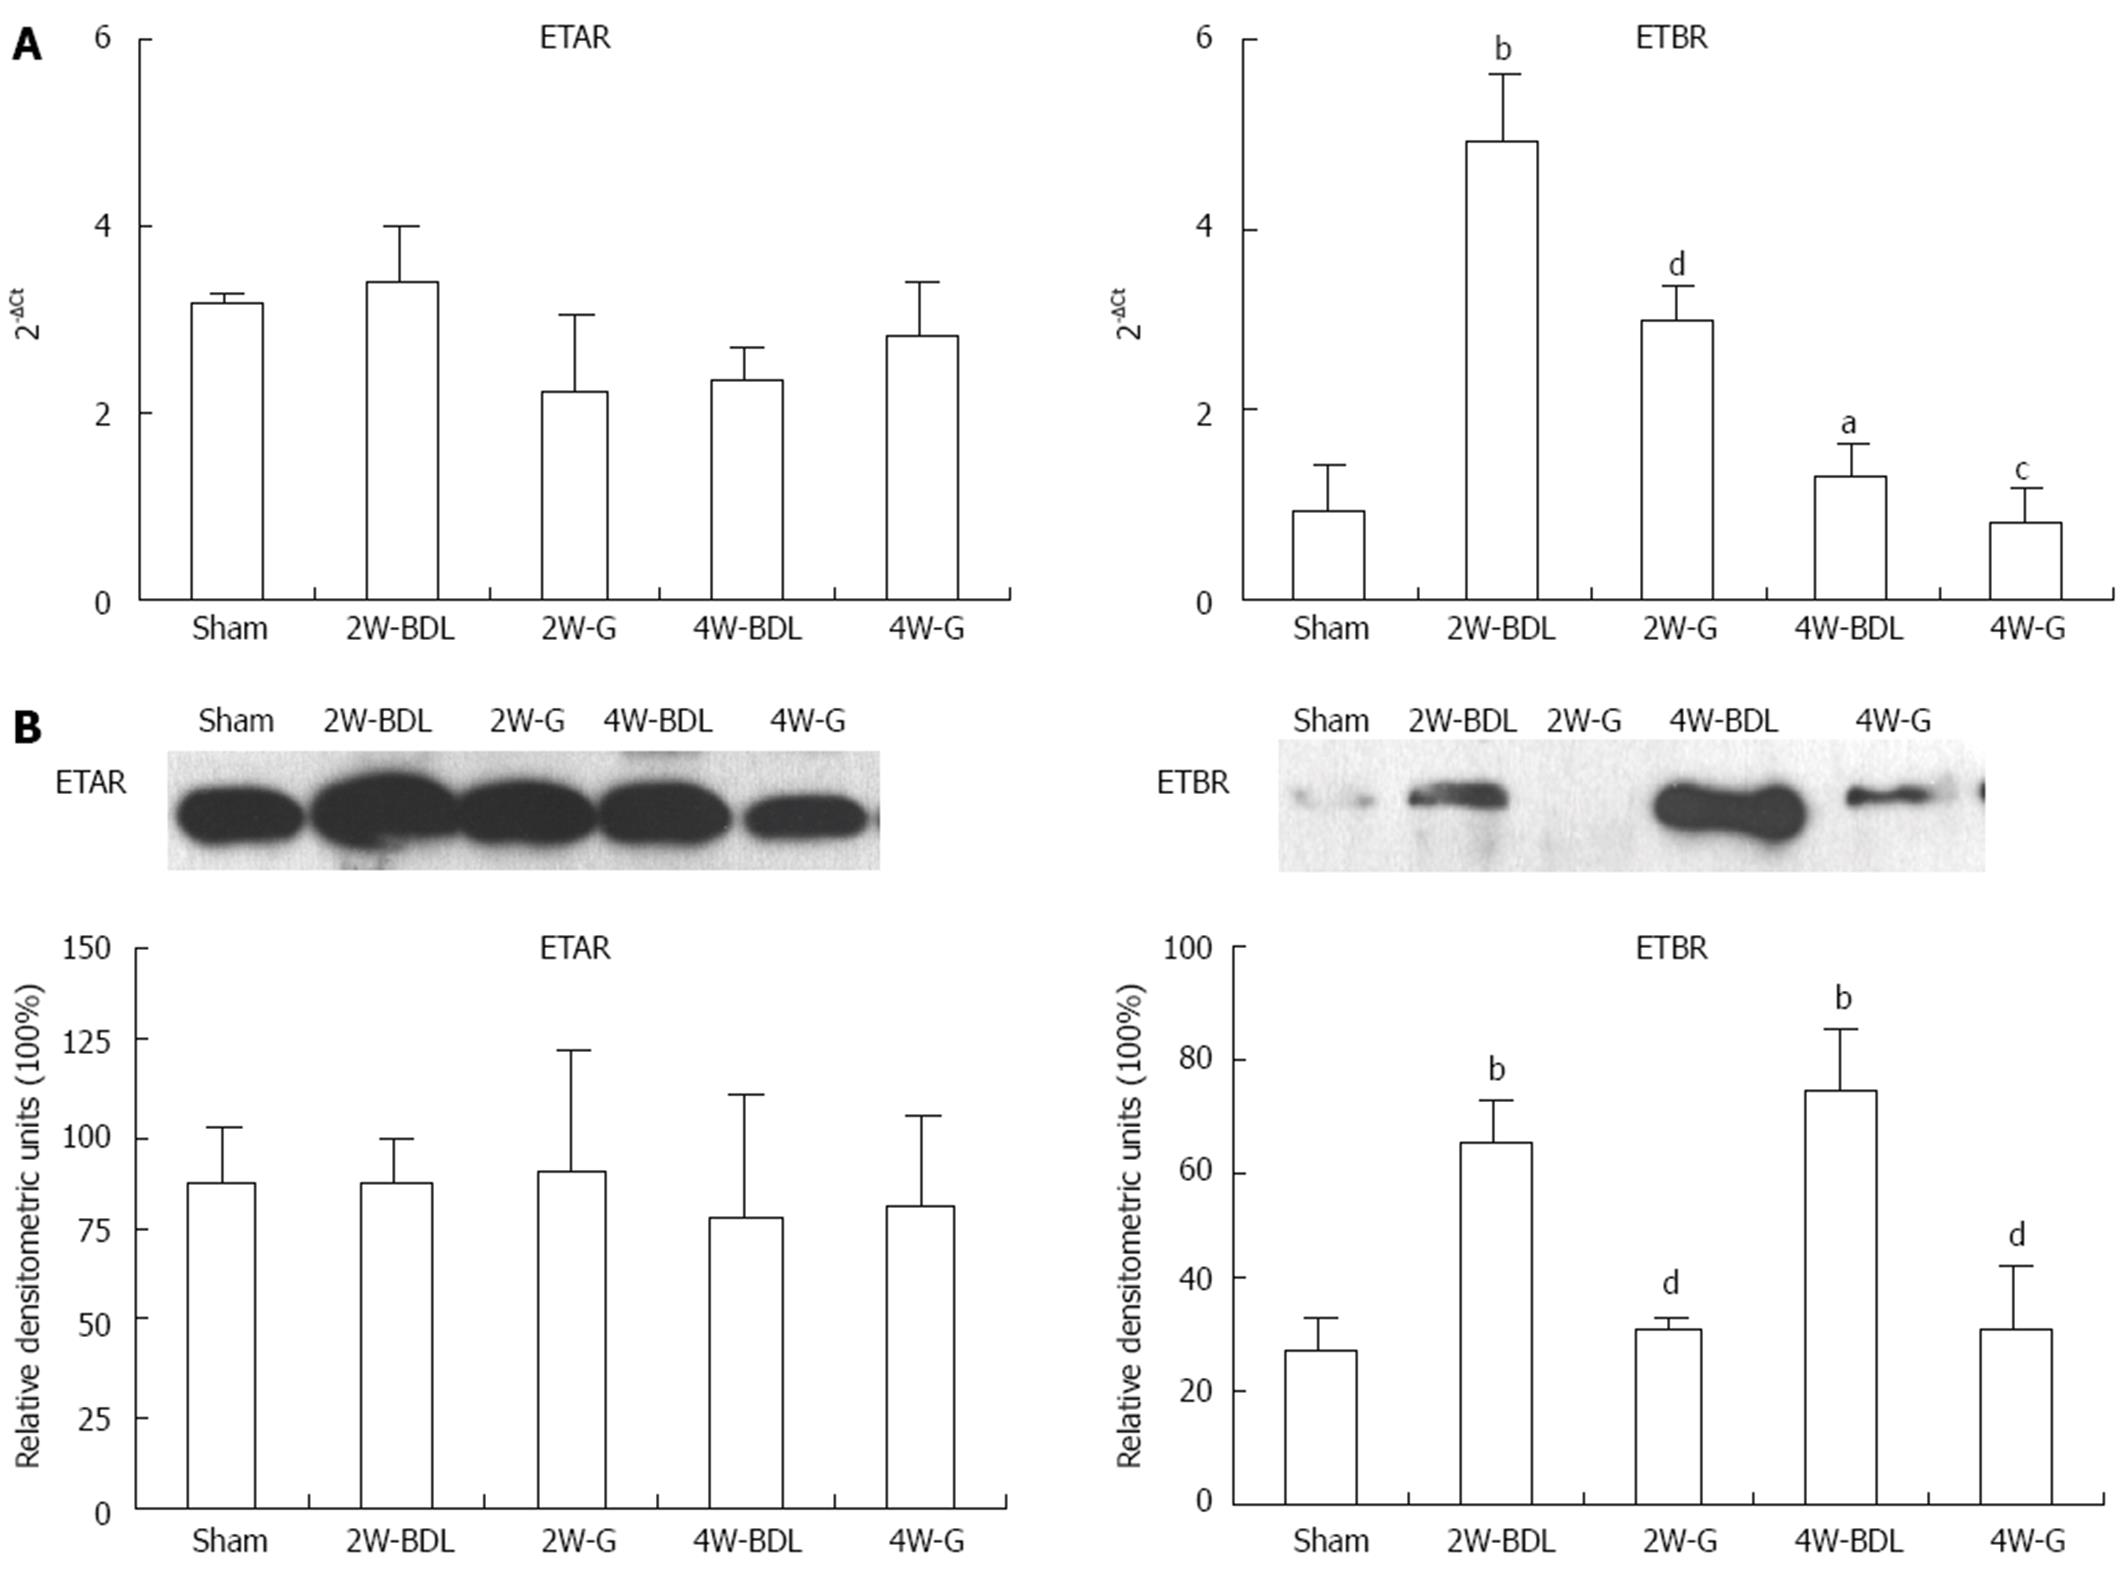
Figure 4 Effect of Glytan on ETAR and ETBR expression at mRNA and protein levels.
A: ETAR and ETBR mRNA levels in the mesentery. Higher 2-∆Ct values represent higher mRNA concentrations. Results from all experiments are shown (n = 7 per group); B: Western blot analysis for ETAR and ETBR protein levels (n = 8 per group). aP < 0.05, bP < 0.01, bile duct ligation (BDL) rats vs sham-operated rats; cP < 0.05, dP < 0.01, rats in the Glytan group vs BDL rats.
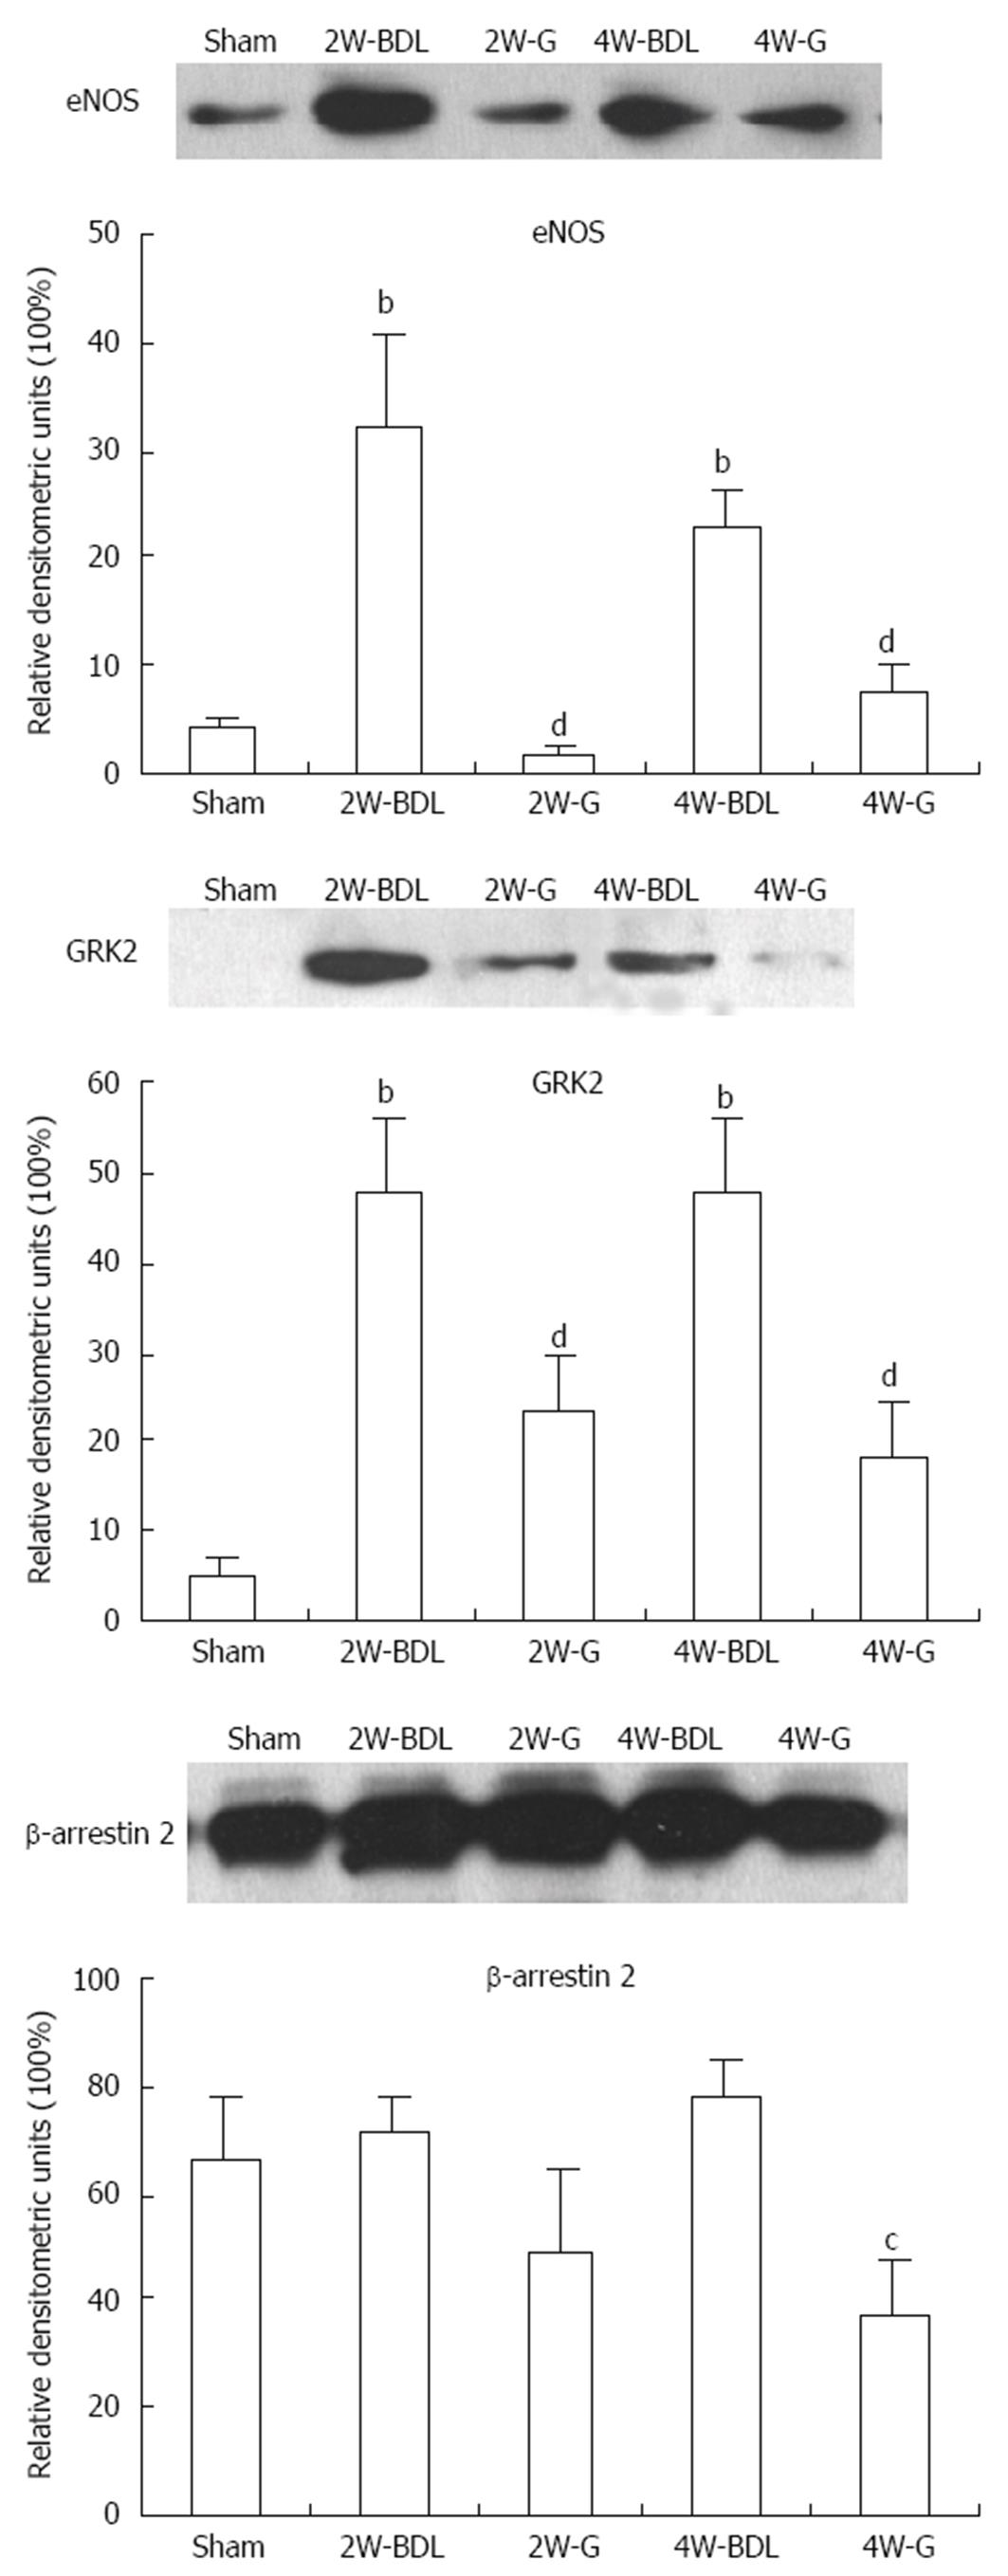
Figure 5 Effect of Glytan on eNOS, GRK2, and β-arrestin 2 expression.
Western blot analysis for eNOS, GRK2 and β-arrestin 2 protein levels (n = 5 per group). bP < 0.01, bile duct ligation (BDL) rats vs sham-operated rats; cP < 0.05,dP < 0.01, rats in the Glytan group vs BDL rats.
-
Citation: Du QH, Han L, Jiang JJ, Xu Y, Li WH, Li PT, Wang XY, Jia X. Glytan decreases portal pressure
via mesentery vasoconstriction in portal hypertensive rats. World J Gastroenterol 2014; 20(44): 16674-16682 - URL: https://www.wjgnet.com/1007-9327/full/v20/i44/16674.htm
- DOI: https://dx.doi.org/10.3748/wjg.v20.i44.16674


