Copyright
©2014 Baishideng Publishing Group Inc.
World J Gastroenterol. Nov 21, 2014; 20(43): 16215-16226
Published online Nov 21, 2014. doi: 10.3748/wjg.v20.i43.16215
Published online Nov 21, 2014. doi: 10.3748/wjg.v20.i43.16215
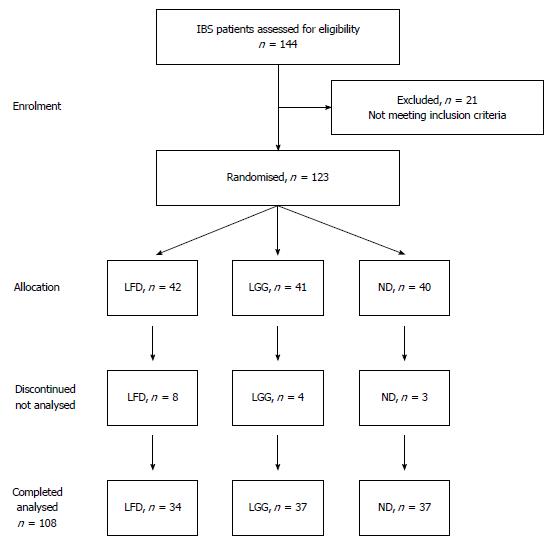
Figure 1 Enrollment and progress of patients with irritable bowel syndrome throughout the study.
LFD: Low fermentable, oligosaccharides, disaccharides, monosaccharides and polyols diet; LGG: Lactobacillus rhamnosus GG; ND: Normal (Danish/Western) diet.
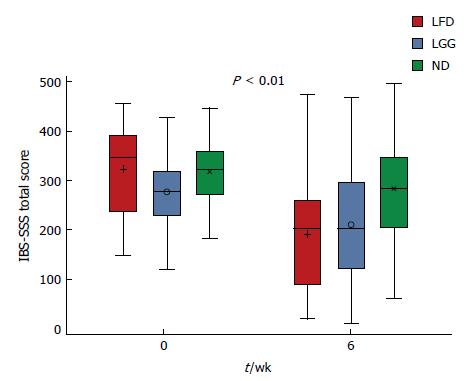
Figure 2 Box plot of irritable bowel syndrome severity score system (IBS-SSS) crude data and the means from the web-based application constant-care for the low fermentable, oligosaccharides, disaccharides, monosaccharides and polyols diet, Lactobacillus rhamnosus GG and normal (Danish/Western) diet group for week 0 and 6 in the intervention period.
LFD: Low fermentable, oligosaccharides, disaccharides, monosaccharides and polyols diet; LGG: Lactobacillus rhamnosus GG; ND: Normal (Danish/Western) diet.
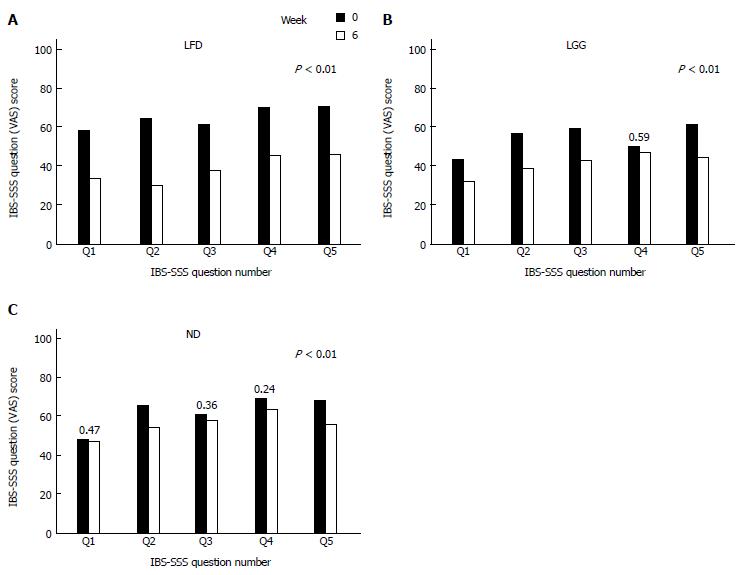
Figure 3 Comparison of irritable bowel syndrome severity score system each question (Q) score between week 0 and 6.
A: In low fermentable, oligosaccharides, disaccharides, monosaccharides and polyols diet (LFD); B: Lactobacillus rhamnosus GG (LGG); C: Normal (Danish/Western) diet (ND) group. Y axis: Irritable bowel syndrome severity score system (IBS-SSS) question mean score; X axis: IBS-SSS (Q1-5). IBS-SSS (severity scoring system) questionnaire includes five questions on a 0-100 VAS scale: severity of abdominal pain (Q1), frequency of abdominal pain (Q2), severity of abdominal distension (Q3), dissatisfaction with bowel habits (Q4), and interference with quality of life (Q5).
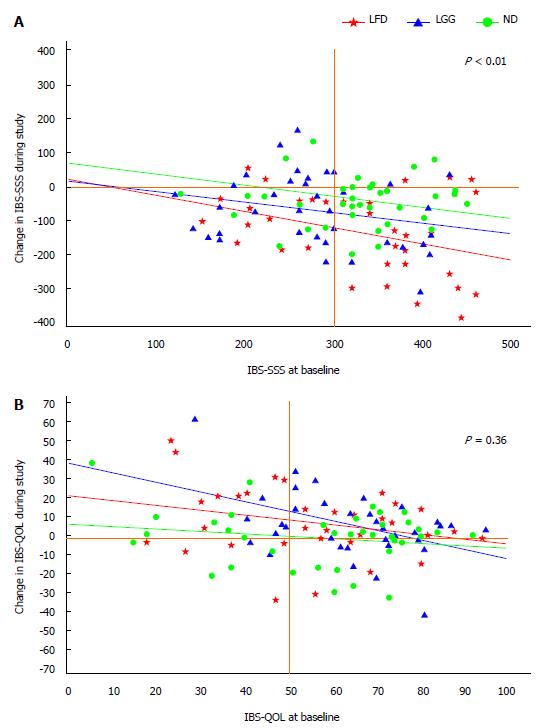
Figure 4 Adjusted linear regression analysis.
A: Changes of irritable bowel syndrome severity score system (IBS-SSS) from baseline toward the end of the study (week 6) in all three groups by baseline covariates, x axis: IBS-SSS at baseline; y axis: Change in IBS-SSS during study; B: Changes of IBS-quality of live (QOL) from baseline toward the end of the study (week 6) in all three groups by baseline covariates. LFD: Low fermentable, oligosaccharides, disaccharides, monosaccharides and polyols diet; LGG: Lactobacillus rhamnosus GG; ND: Normal (Danish/Western) diet.
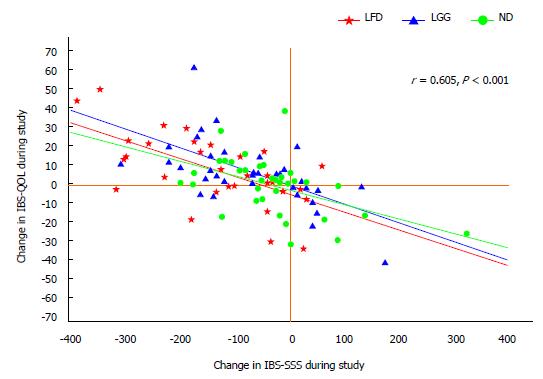
Figure 5 Correlation between changes in irritable bowel syndrome severity score system and quality of life during study period of 6-wk in all three groups.
Y axis: Change of irritable bowel syndrome quality of life (IBS-QOL) during study; X axis: Change in irritable bowel syndrome severity score system (IBS-SSS) during study. Improvement of IBS-SSS correlates well with the improvement in IBS-QOL in all three groups. LFD: Low fermentable, oligosaccharides, disaccharides, monosaccharides and polyols diet; LGG: Lactobacillus rhamnosus GG; ND: Normal (Danish/Western) diet.
-
Citation: Pedersen N, Andersen NN, Végh Z, Jensen L, Ankersen DV, Felding M, Simonsen MH, Burisch J, Munkholm P. Ehealth: Low FODMAP diet
vs Lactobacillus rhamnosus GG in irritable bowel syndrome. World J Gastroenterol 2014; 20(43): 16215-16226 - URL: https://www.wjgnet.com/1007-9327/full/v20/i43/16215.htm
- DOI: https://dx.doi.org/10.3748/wjg.v20.i43.16215


