Copyright
©2014 Baishideng Publishing Group Inc.
World J Gastroenterol. Nov 14, 2014; 20(42): 15899-15909
Published online Nov 14, 2014. doi: 10.3748/wjg.v20.i42.15899
Published online Nov 14, 2014. doi: 10.3748/wjg.v20.i42.15899
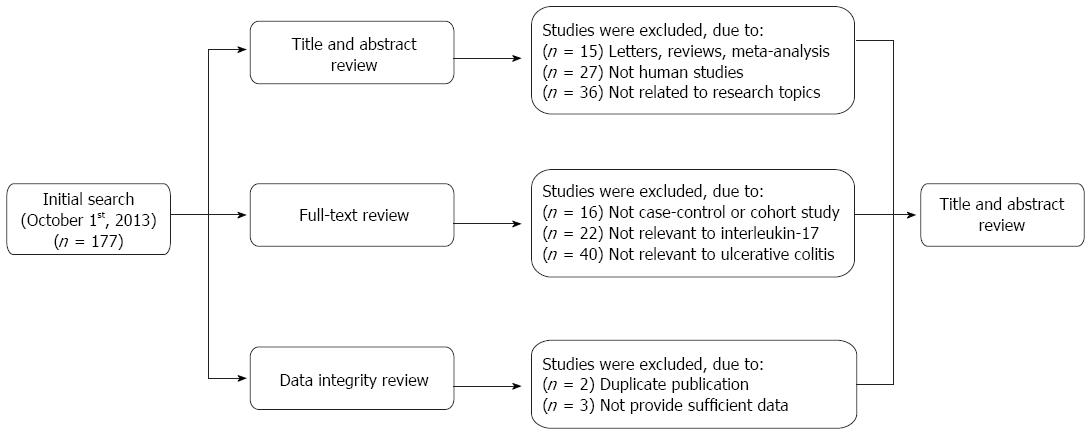
Figure 1 Flow chart of the literature search and study selection.
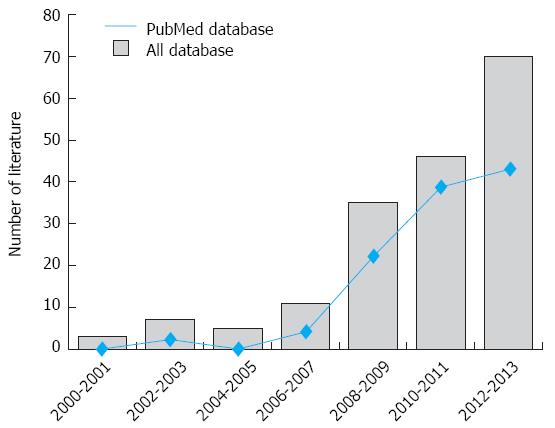
Figure 2 Distribution of the number of topic-related literatures in the electronic databases.
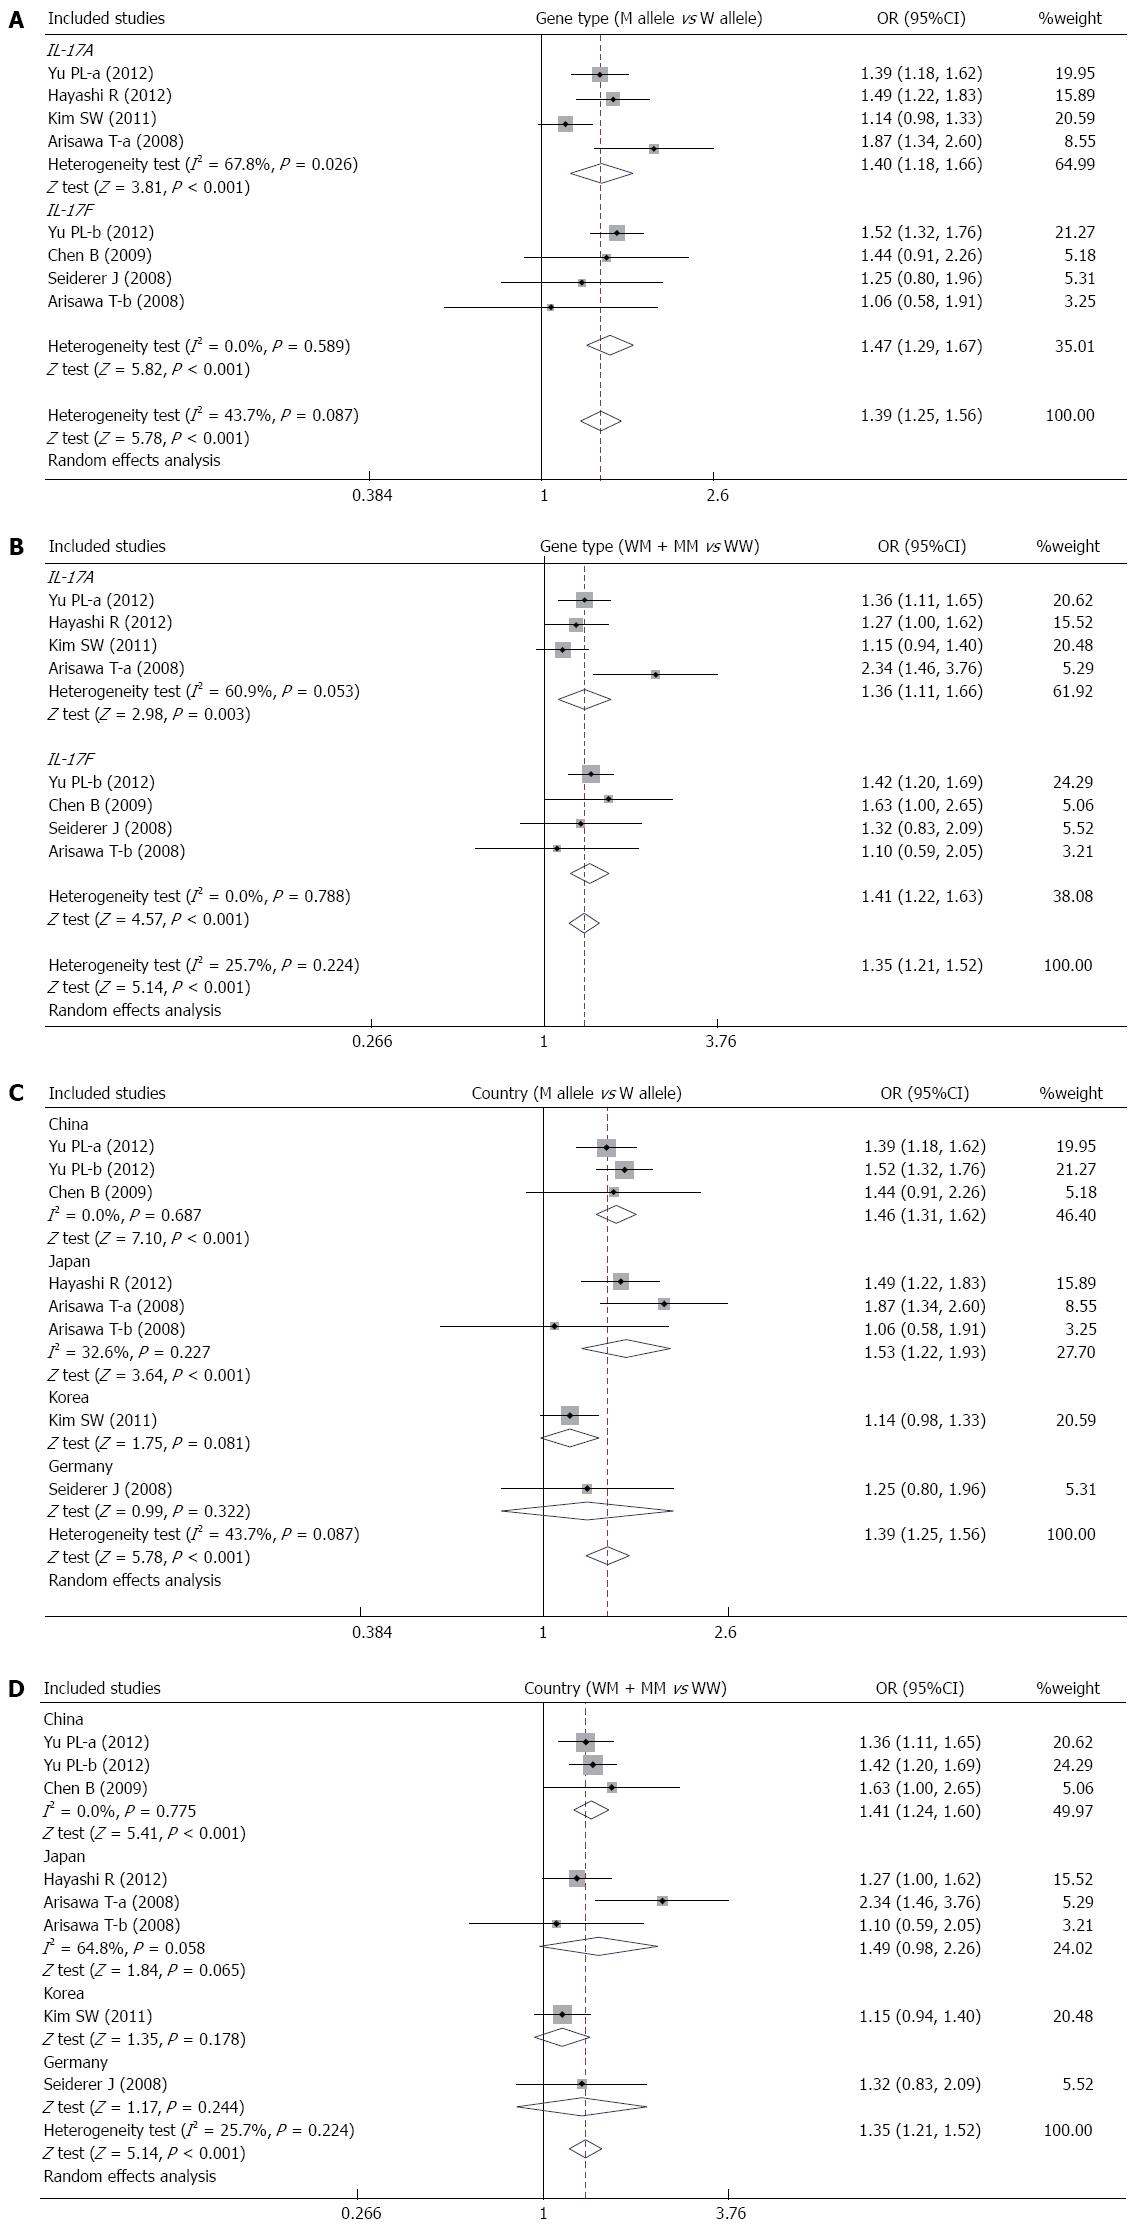
Figure 3 Forest plots of the relationship between IL-17A/F genetic polymorphisms and ulcerative colitis risk under the allele and dominant models.
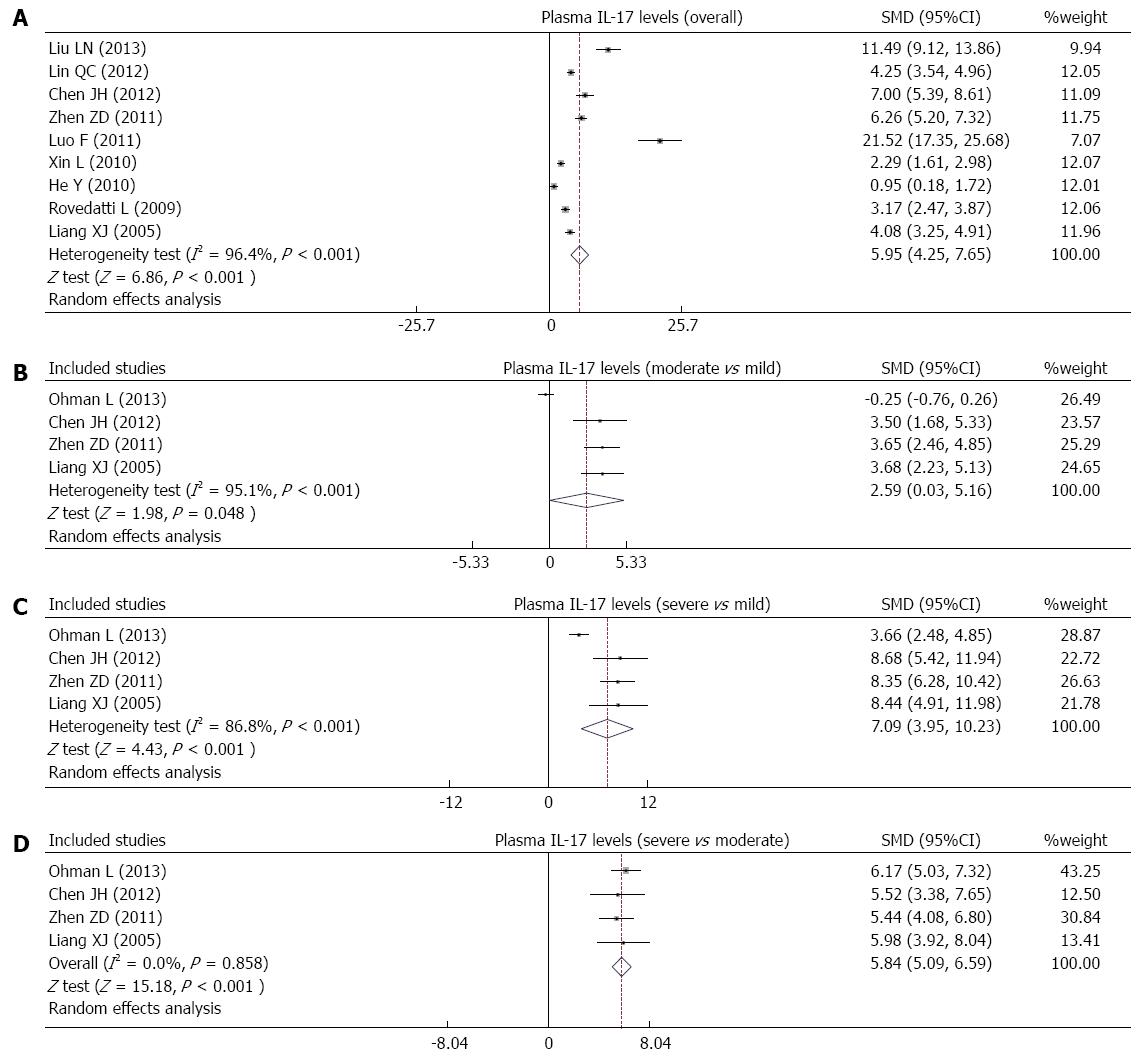
Figure 4 Forest plots of the relationship between serum interleukin-17 levels and ulcerative colitis risk under the allele and dominant models.
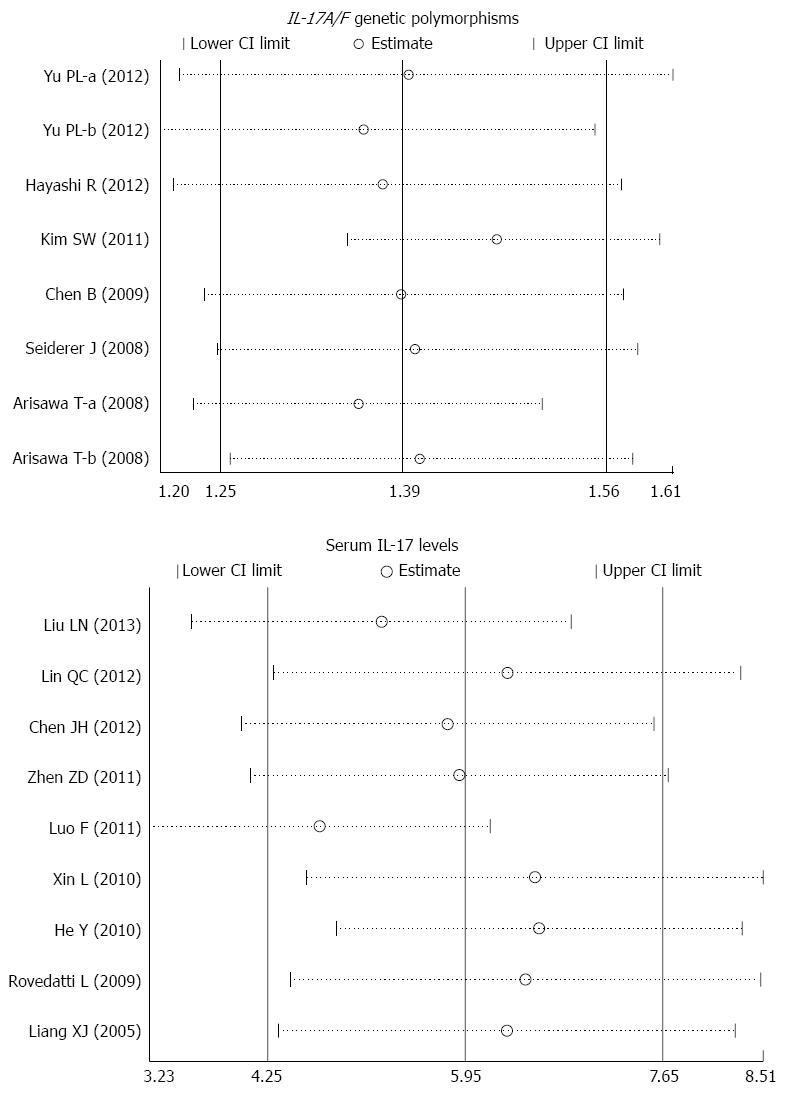
Figure 5 Sensitivity analyses of the summary odds ratio coefficients for the associations of interleukin-17/F polymorphisms and serum interleukin-17 levels with susceptibility to ulcerative colitis.
Results were computed by omitting each study in turn. Meta-analysis random effects estimates (exponential form) were used. The two ends of the dotted lines represent the 95%CI.
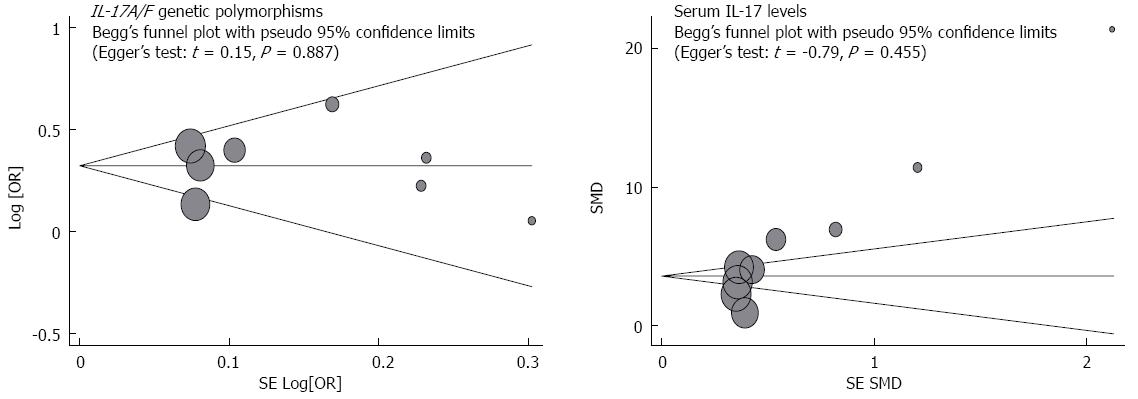
Figure 6 Begger’s funnel plot of publication biases on the associations of interleukin-17/F polymorphisms and serum interleukin-17 levels with susceptibility to ulcerative colitis.
Each point represents a separate study for the indicated association. Log (OR) refers to the natural logarithm of the odds ratio; Horizontal line indicates the mean magnitude of the effect. IL-17: Interleukin-17.
- Citation: Li J, Tian H, Jiang HJ, Han B. Interleukin-17 SNPs and serum levels increase ulcerative colitis risk: A meta-analysis. World J Gastroenterol 2014; 20(42): 15899-15909
- URL: https://www.wjgnet.com/1007-9327/full/v20/i42/15899.htm
- DOI: https://dx.doi.org/10.3748/wjg.v20.i42.15899


