Copyright
©2014 Baishideng Publishing Group Inc.
World J Gastroenterol. Nov 14, 2014; 20(42): 15549-15563
Published online Nov 14, 2014. doi: 10.3748/wjg.v20.i42.15549
Published online Nov 14, 2014. doi: 10.3748/wjg.v20.i42.15549
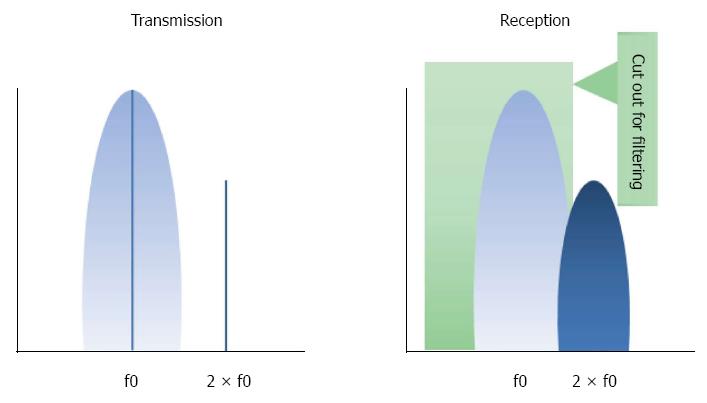
Figure 1 Schematic view of the frequency range used for filtering the second harmonic.
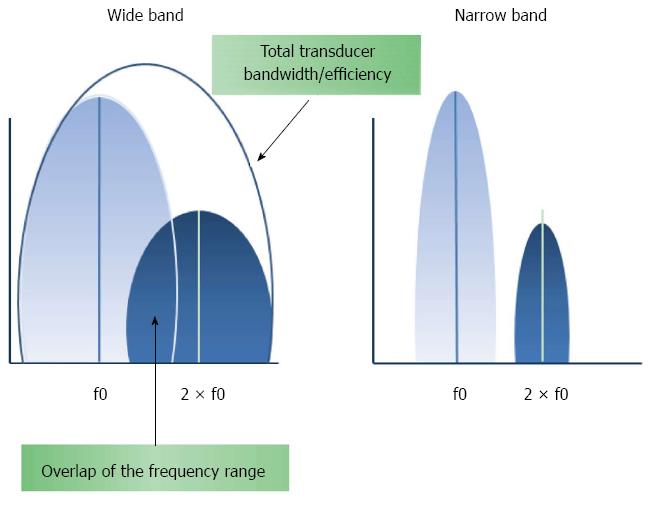
Figure 2 Effects of narrowing the band pulse.
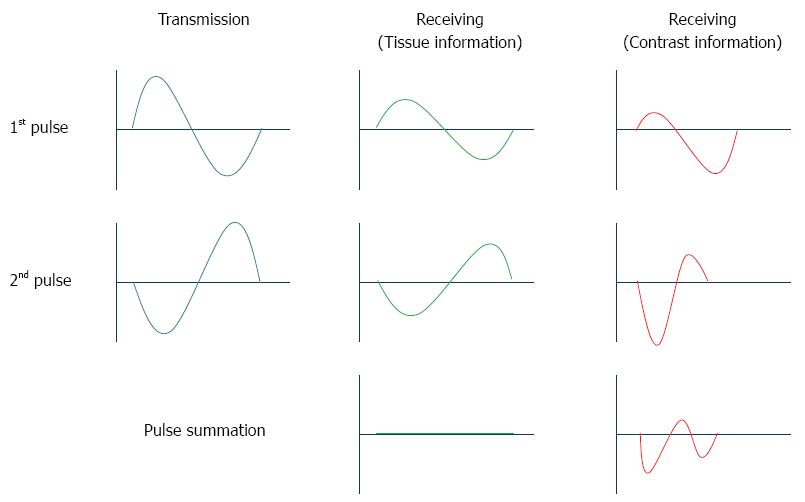
Figure 3 Principle of phase inversion mode.
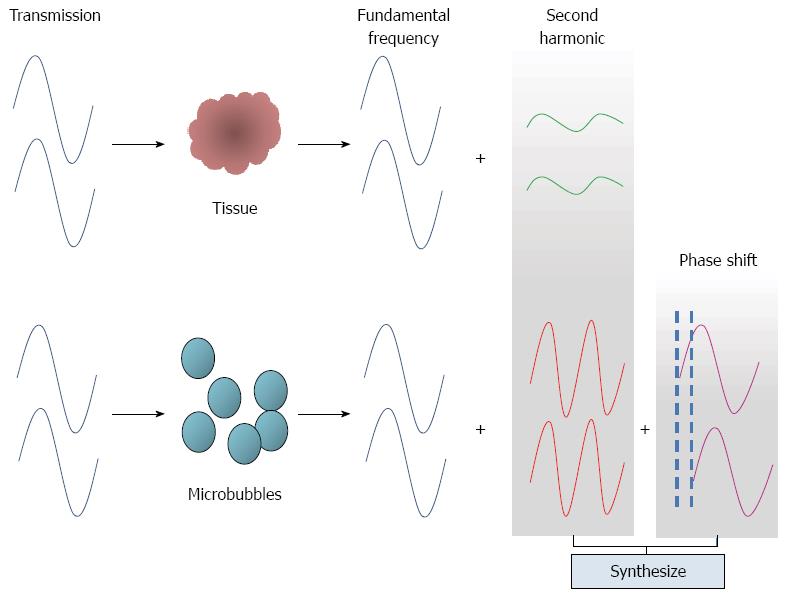
Figure 4 Principle of extended pure harmonic technique.
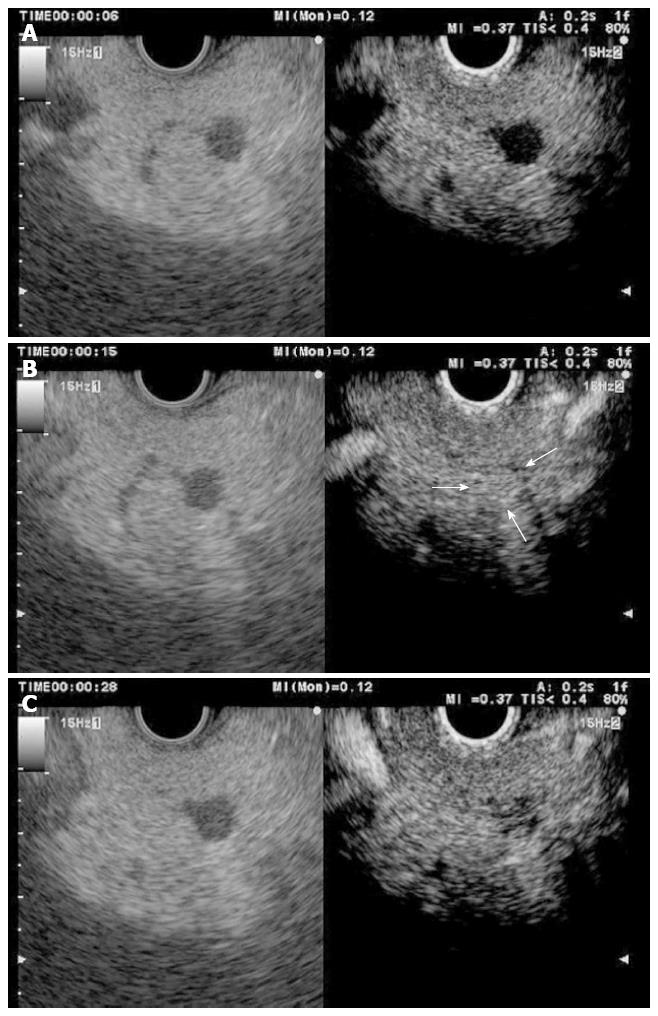
Figure 5 Pancreatic neuroendocrine tumour (left side B mode, right side CH mode).
A: No tumour enhancement is observed 6 s after injecting the contrast; B: 15 s after the injection, the contrast uptake is maximal; C: 30 s after the injection, the enhancement begins to decrease.
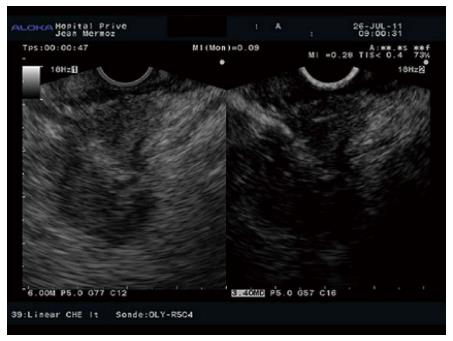
Figure 6 Hypoenhanced pattern in a pancreatic adenocarcinoma.
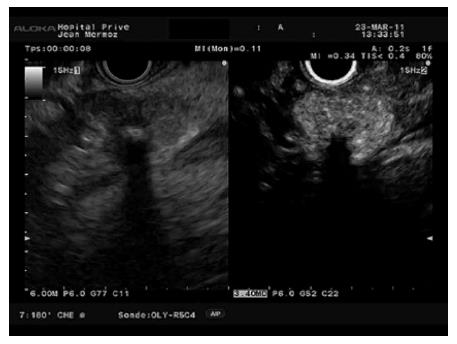
Figure 7 Hyperenhanced pattern in a pancreatic neuroendocrine tumour.
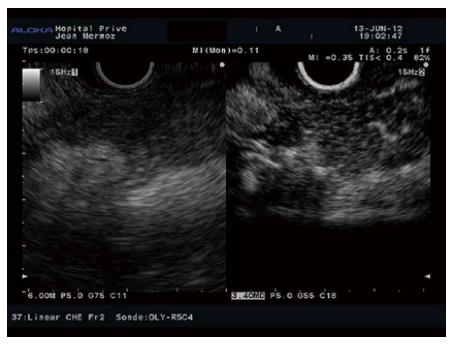
Figure 8 Autoimmune pancreatitis with hypoechogenic aspect in B mode (left image) and diffuse enhancement in contrast mode (right image).
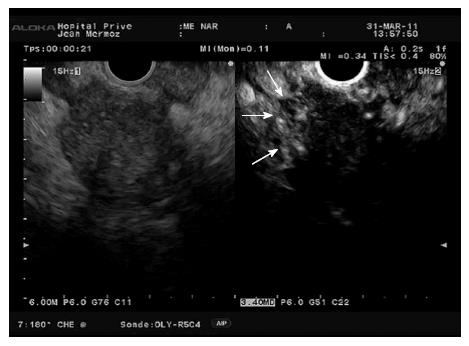
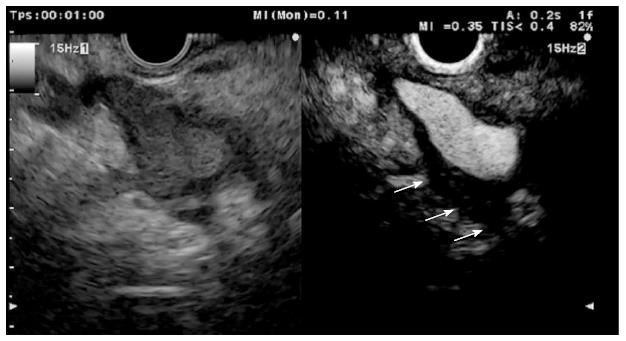
Figure 9 Hypoenhanced pancreatic adenocarcinoma with hyperenhanced peripheral foci (arrows) corresponding to inflammatory changes.
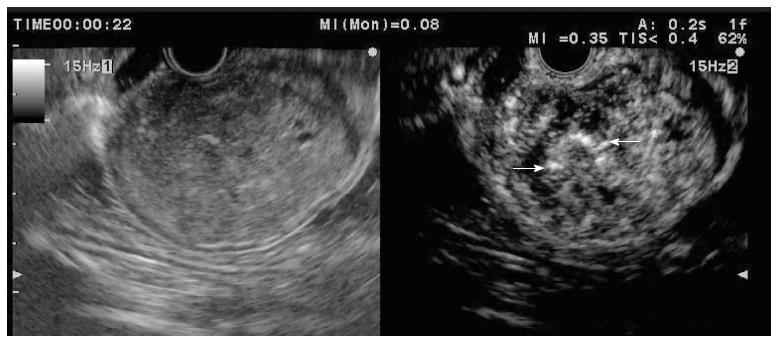
Figure 10 Gastric gastrointestinal stromal tumour displayed as hyperenhanced submucosal lesion with some macrovessels (arrows) inside the tumour.
Figure 11 Duodenal carcinoid tumour: Hyperenhancement after contrast injection.
Figure 12 Leiomyoma of the gastric cardias showing a hypoenhanced pattern.
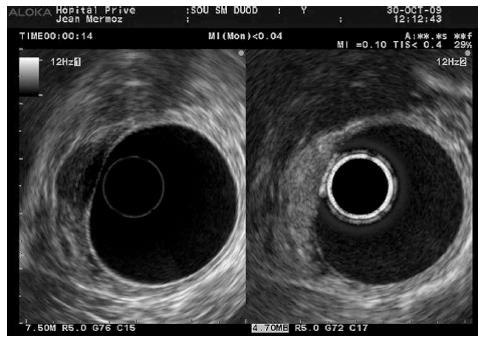
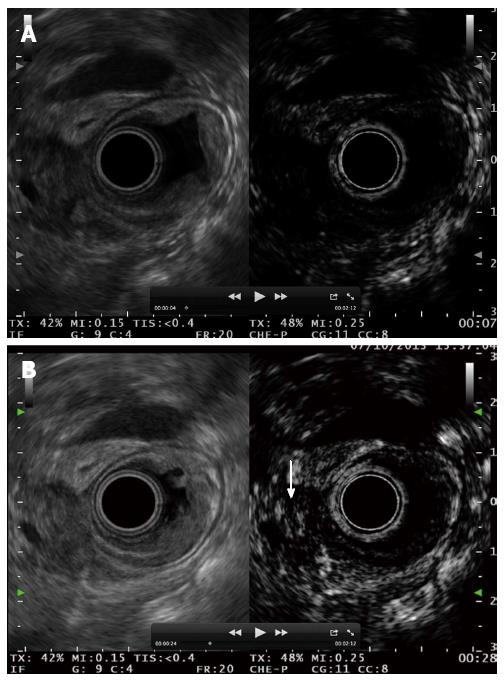
Figure 13 Ampullary tumour with echoic material inside the distal bile duct.
A: No enhancement is observed 7 s after contrast injection; B: Bile duct involvement is diagnosed after contrast enhancement 28 s after the injection.
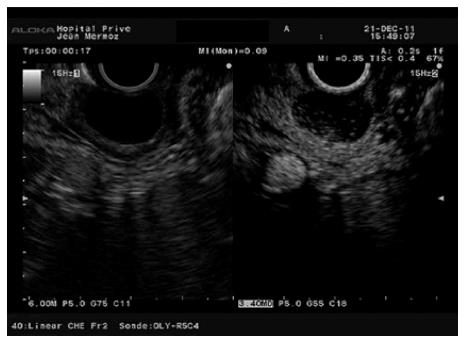
Figure 14 Perivascular infiltration by a pancreatic adenocarcinoma displayed as a hypoechoic wall thickening of the celiac artery (arrows).
- Citation: Alvarez-Sánchez MV, Napoléon B. Contrast-enhanced harmonic endoscopic ultrasound imaging: Basic principles, present situation and future perspectives. World J Gastroenterol 2014; 20(42): 15549-15563
- URL: https://www.wjgnet.com/1007-9327/full/v20/i42/15549.htm
- DOI: https://dx.doi.org/10.3748/wjg.v20.i42.15549


