Copyright
©2014 Baishideng Publishing Group Inc.
World J Gastroenterol. Nov 7, 2014; 20(41): 15177-15189
Published online Nov 7, 2014. doi: 10.3748/wjg.v20.i41.15177
Published online Nov 7, 2014. doi: 10.3748/wjg.v20.i41.15177
Figure 1 Contrast-enhanced computed tomography findings in autoimmune pancreatitis.
A: Enlargement of the distal pancreatic body and tail (between arrowheads), with fine peri-pancreatic stranding of the adjacent fat (small arrow); B: The “capsule” or “rim” sign, a hypo-attenuating rim encircling the anterior and posterior margin of the pancreas (white arrows); C: Multifocal main pancreatic duct narrowing (black arrow).
Figure 2 Delayed enhancement on computed tomography and magnetic resonance imaging in autoimmune pancreatitis.
A, B, C: Focal autoimmune pancreatitis in the pancreatic tail (white arrow) with delayed early arterial enhancement on arterial phase computed tomography (CT) (A) and magnetic resonance (B, fat-saturated T1-weighted image, 30 s post-injection), with subsequent delayed enhancement (C, fat-saturated T1-weighted image, 180 s post-injection); D: Follow-up CT after corticosteroid therapy demonstrating resolution of prior enhancement abnormality (white arrow).
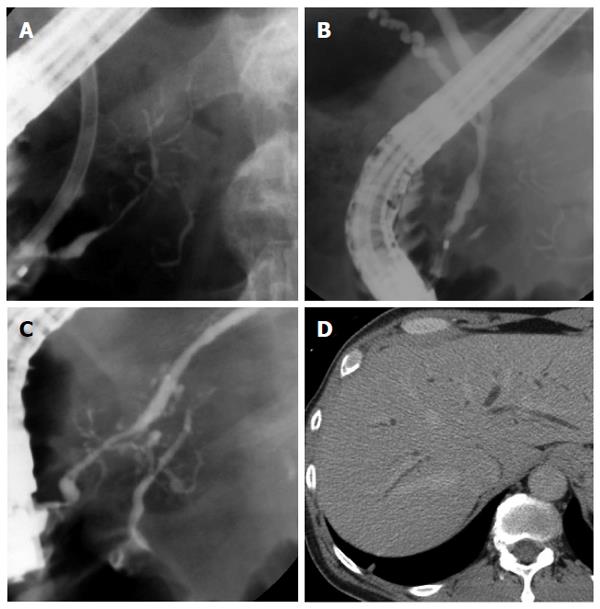
Figure 3 Biliary involvement in autoimmune pancreatitis.
A, B, C: Endoscopic retrograde cholangiopancreatographydemonstrating diffuse narrowing of the main pancreatic duct (A) and segmental narrowing of the lower common bile duct (B), with improvement of main pancreatic duct narrowing after therapy (C); D: Computed tomographic image demonstrating intrahepatic biliary ductal dilatation in a patient with biliary involvement from IgG4-related disease.
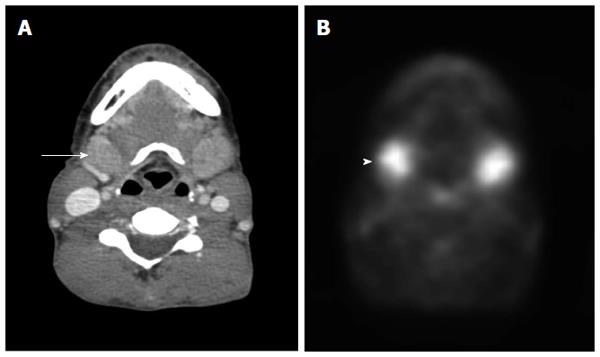
Figure 4 Head and neck findings in IgG4-related disease demonstrated by 2-(18)F-fluoro-2-deoxy-d-glucose positron emission tomography/computed tomography.
A: Bilateral, enlarged submandibular glands on computed tomography (arrow); B: Corresponding intense 2-(18)F-fluoro-2-deoxy-d-glucose uptake at the submandibular glands (arrowhead).
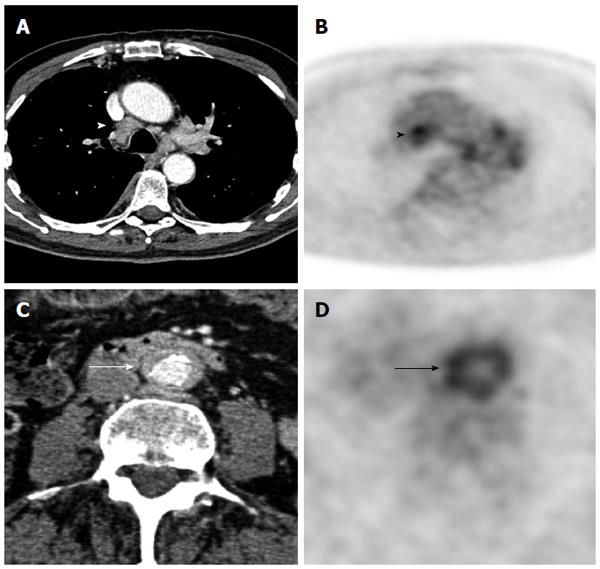
Figure 5 Thoracic and abdominal findings in IgG4-related disease demonstrated by 2-(18)F-fluoro-2-deoxy-d-glucose positron emission tomography/computed tomography.
A, B: Paratracheal mediastinal lymphadenopathy on computed tomography (CT) (A, white arrowhead) and positron emission tomography (PET) (B, black arrowhead); C, D: Retroperitoneal fibrosis on CT (C, white arrow) and PET (D, black arrow).
- Citation: Lee LK, Sahani DV. Autoimmune pancreatitis in the context of IgG4-related disease: Review of imaging findings. World J Gastroenterol 2014; 20(41): 15177-15189
- URL: https://www.wjgnet.com/1007-9327/full/v20/i41/15177.htm
- DOI: https://dx.doi.org/10.3748/wjg.v20.i41.15177


