Copyright
©2014 Baishideng Publishing Group Inc.
World J Gastroenterol. Oct 28, 2014; 20(40): 15001-15006
Published online Oct 28, 2014. doi: 10.3748/wjg.v20.i40.15001
Published online Oct 28, 2014. doi: 10.3748/wjg.v20.i40.15001
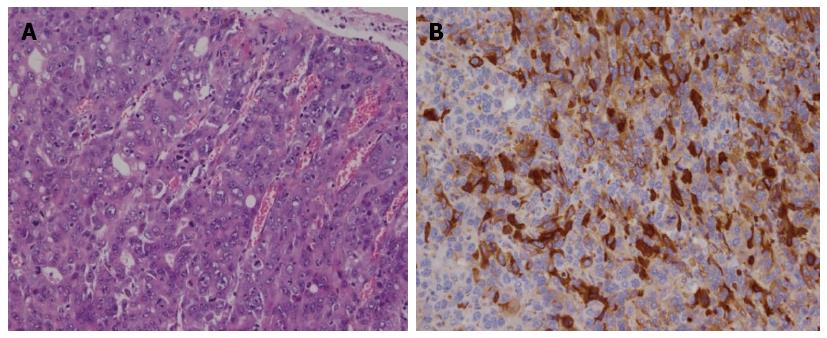
Figure 1 Histopathology of hepatoid carcinoma in gastric primary lesion.
A: Case no 4. The tumor comprised a mixture of glandular and hepatoid components (hematoxylin and eosin staining; original magnification, × 200); B: Hepatoid areas are outlined by immunopositivity for alpha-fetoprotein.
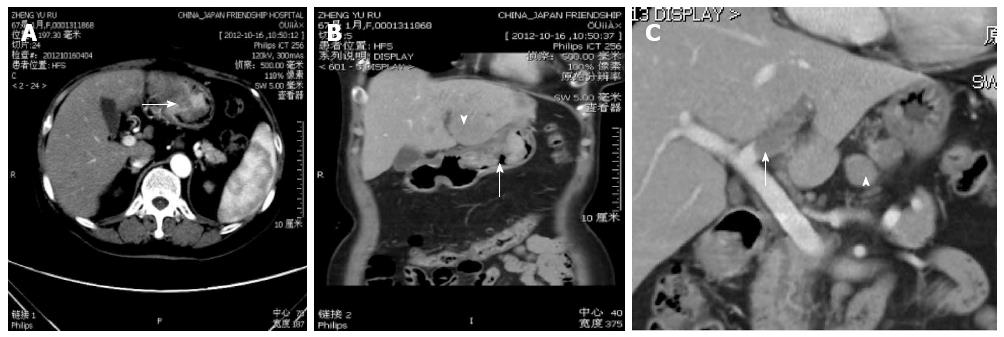
Figure 2 Hepatoid adenocarcinoma of the stomach in a 66-year-old female (patient 1).
A: Transverse computed tomography (CT) scan showing a large polypoid tumor (arrow) and moderate heterogeneous enhancement; B: Coronal reformatted CT image demonstrating a large protruding mass with a central ulceration (arrow). The multiplanar reformations (MPR) image seemed better than the transverse images for morphological features of the tumor. A metastatic hepatic mass was identified in the left lobe (arrowhead); C: An MPR image showing a slightly enhanced filling defect in the left lobar branch of the portal vein, suggestive of tumor thrombus (arrow), and an adjacent metastatic lymph node (arrowhead).
Figure 3 Hepatoid adenocarcinoma of the stomach in a 61-year-old male (patient 3).
Transverse dynamic contrast-enhanced computed tomography showing an tumor that is enhanced from the arterial phase to the delayed phase. A: The arterial phase computed tomography scan reveals polypoid lesions at the posterior wall of the gastric antrum (arrow). The heterogeneous mild enhancement pattern is shown; B and C: The tumor (arrows) is enhanced persistently in the portal phase (B) and delayed phase (C).
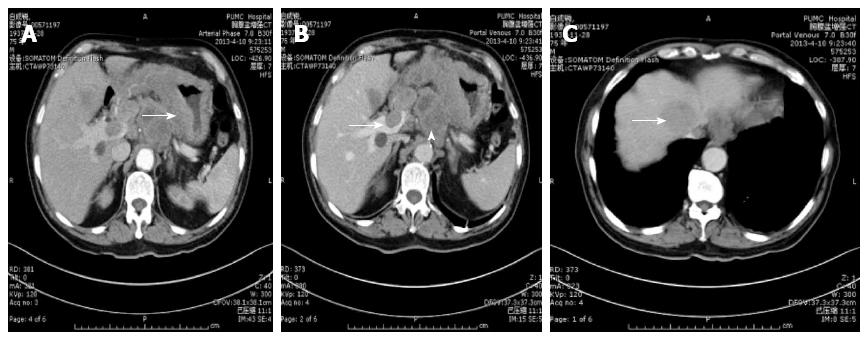
Figure 4 A 75-year-old man with hepatoid adenocarcinoma of the stomach (patient 6).
A: Contrast-enhanced computed tomography (CT) scan during the arterial phase shows diffuse bilayered appearance of gastric wall thickening with a mild hyperdense inner layer and a 20 mm hypodense outer layer (arrow); B: Tumor thrombus is visualized as a mildly enhanced filling defect in the left portal vein (arrow). Lymph node enlargement is present close to left gastric artery trunk, necrotic foci was identified as metastasis (arrowhead); C: Transverse CT scan showing a slightly peripherally enhanced low-attenuation bulky metastatic liver mass (arrow).
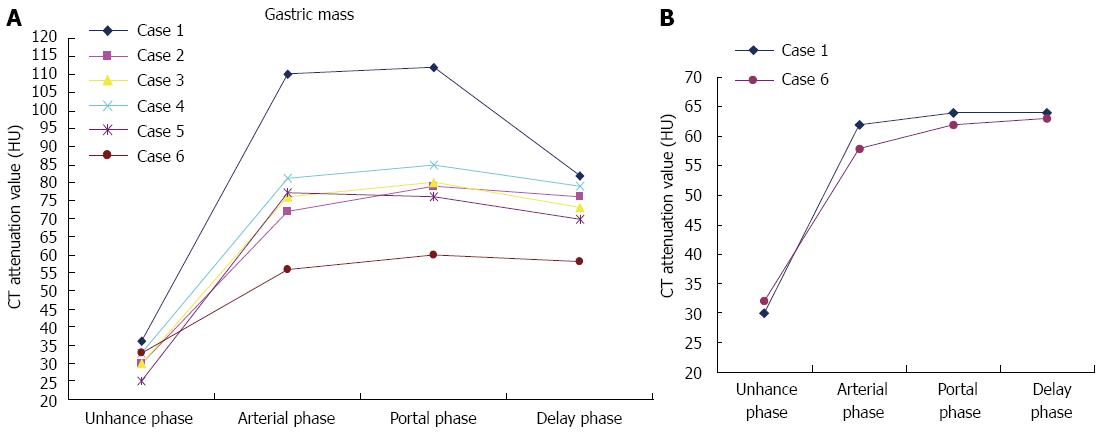
Figure 5 Time-density curve of gastric lesion and venous tumor thrombus.
A: The mean attenuation of the gastric lesion showed a peak in the arterial phase and persistent enhancement without absolute loss of enhancement in the portal and delayed phases; B: The graph shows a slight enhancement of tumor thrombus with a similar enhancement pattern to that of hepatoid adenocarcinoma of the stomach. CT: Computed tomography.
- Citation: Ren A, Cai F, Shang YN, Ma ES, Huang ZG, Wang W, Luo J. Gastric hepatoid adenocarcinoma: A computed tomography report of six cases. World J Gastroenterol 2014; 20(40): 15001-15006
- URL: https://www.wjgnet.com/1007-9327/full/v20/i40/15001.htm
- DOI: https://dx.doi.org/10.3748/wjg.v20.i40.15001


