Copyright
©2014 Baishideng Publishing Group Inc.
World J Gastroenterol. Oct 28, 2014; 20(40): 14973-14985
Published online Oct 28, 2014. doi: 10.3748/wjg.v20.i40.14973
Published online Oct 28, 2014. doi: 10.3748/wjg.v20.i40.14973
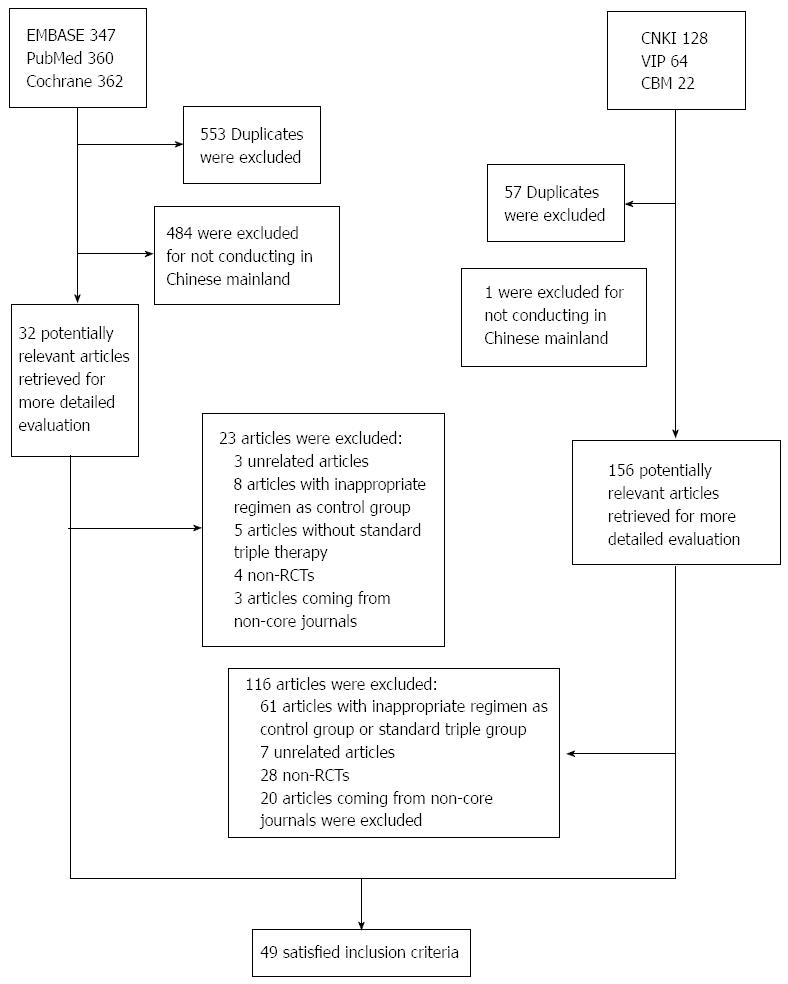
Figure 1 Flow diagram of studies identified and selected.
RCT: Randomized controlled trials; CNKI: China National Knowledge Infrastructure database; CBM: Chinese Biomedical Database.
Figure 2 Forest plot of standard triple therapy vs dual therapy by random effect model.
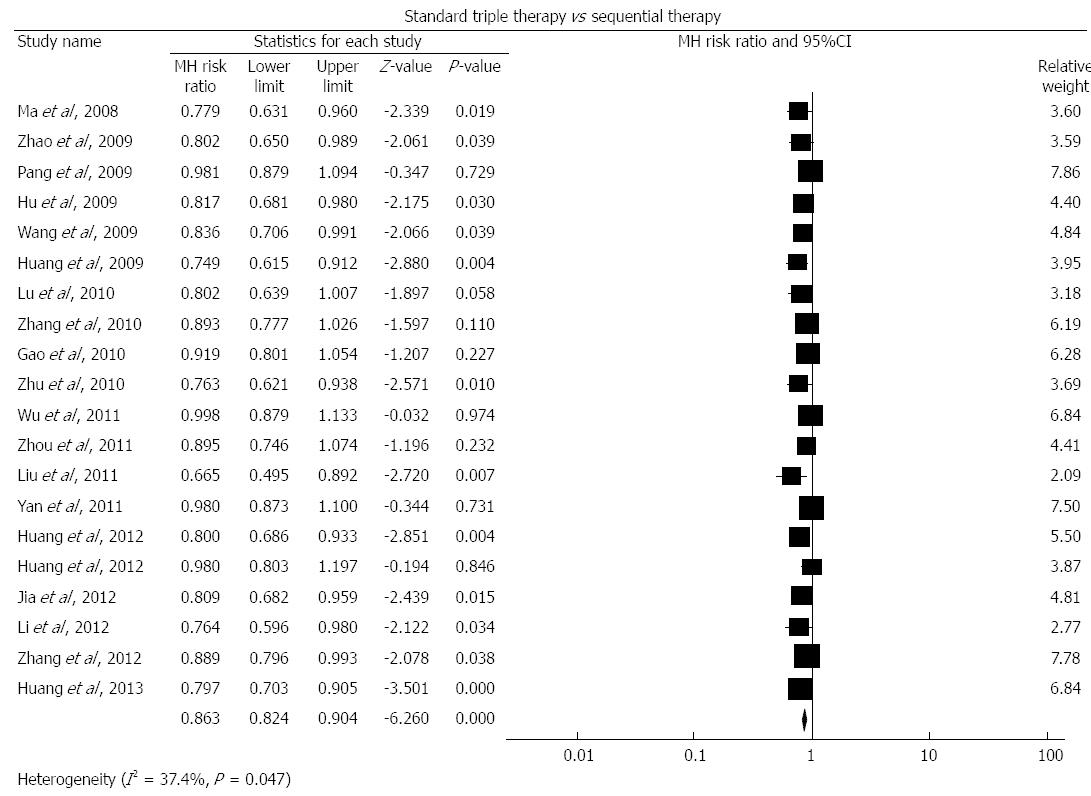
Figure 3 Forest plot of standard triple therapy vs sequential therapy by random effect model.
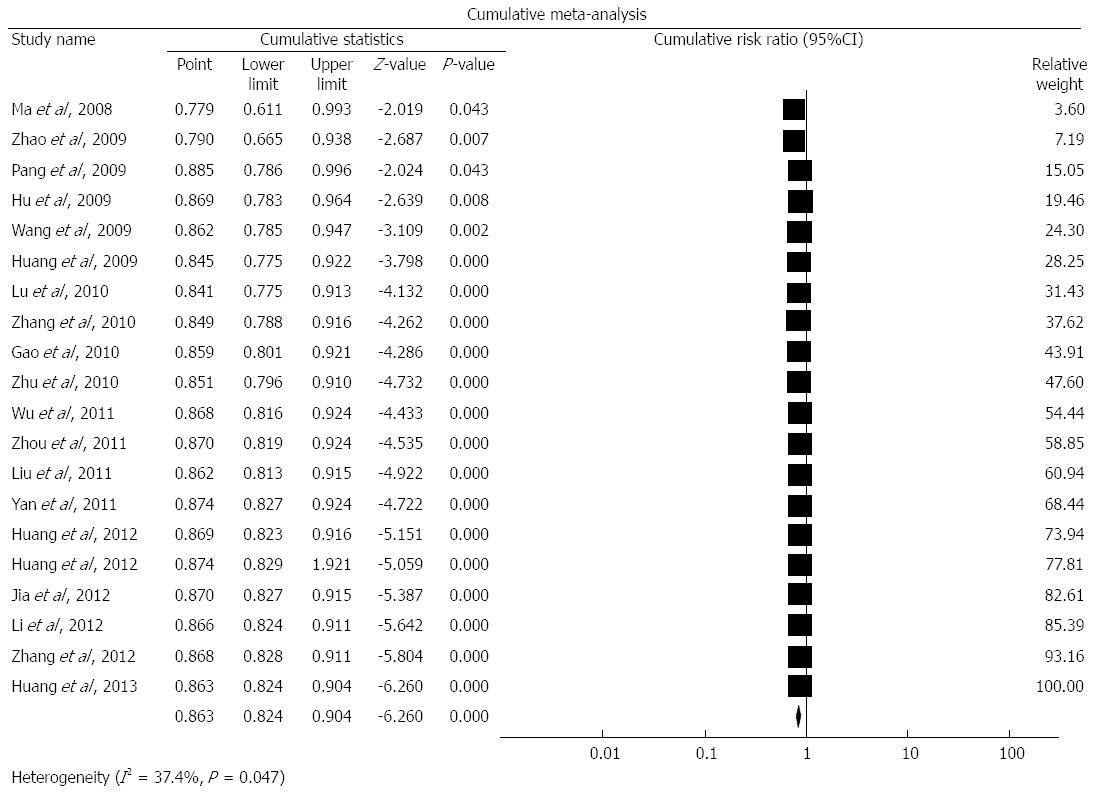
Figure 4 Cumulative meta-analysis of standard triple therapy vs sequential therapy by random effect model.
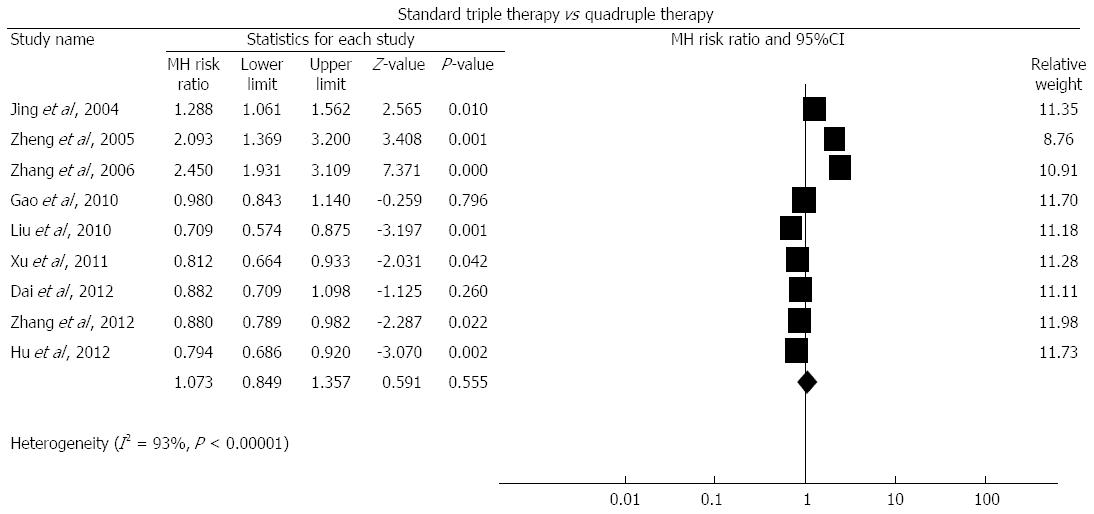
Figure 5 Forest plot of standard triple therapy vs quadruple therapy by random effect model.
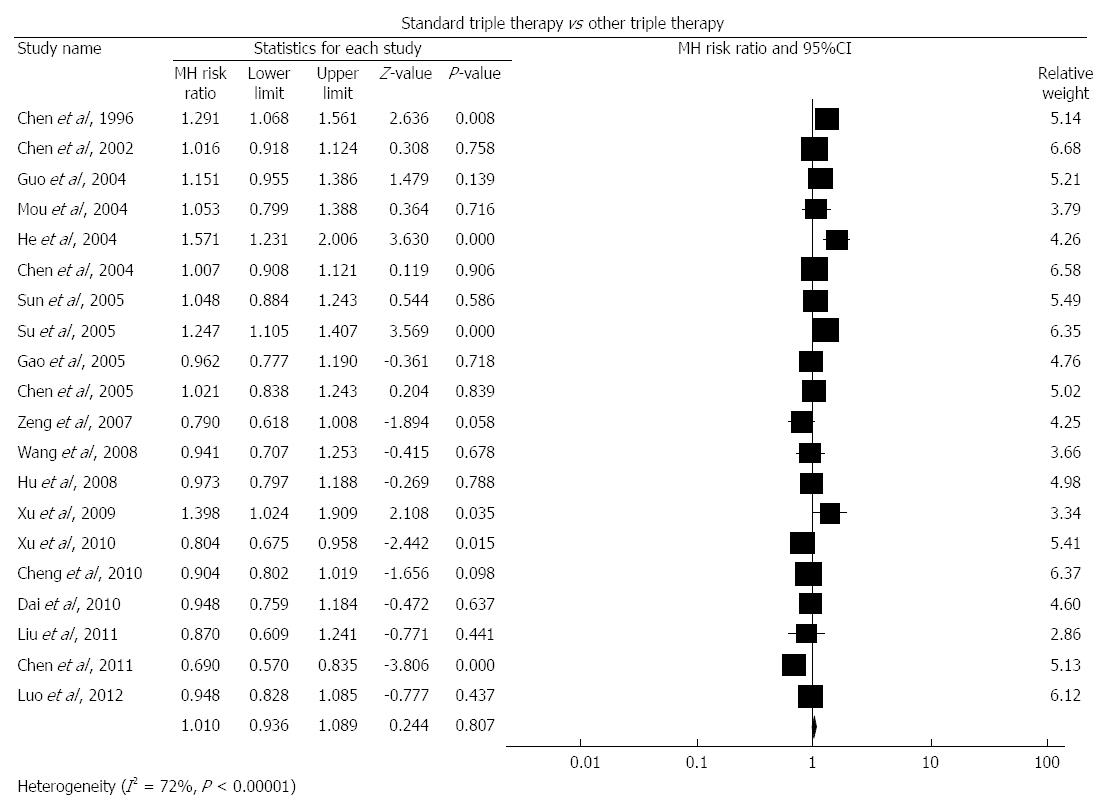
Figure 6 Forest plot of standard triple therapy vs other triple therapy by random effect model.
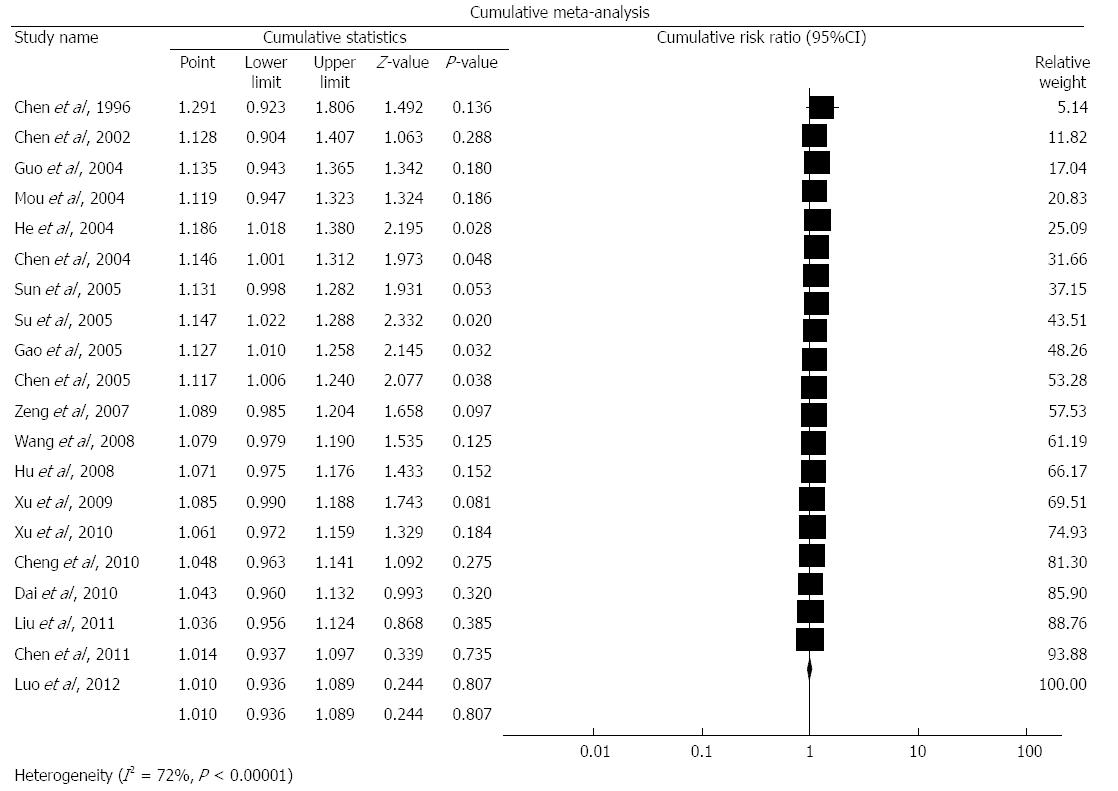
Figure 7 Cumulative meta-analysis of standard triple therapy vs other triple therapy by random effect model.
-
Citation: Wang B, Lv ZF, Wang YH, Wang H, Liu XQ, Xie Y, Zhou XJ. Standard triple therapy for
Helicobacter pylori infection in China: A meta-analysis. World J Gastroenterol 2014; 20(40): 14973-14985 - URL: https://www.wjgnet.com/1007-9327/full/v20/i40/14973.htm
- DOI: https://dx.doi.org/10.3748/wjg.v20.i40.14973


