Copyright
©2014 Baishideng Publishing Group Inc.
World J Gastroenterol. Oct 28, 2014; 20(40): 14884-14894
Published online Oct 28, 2014. doi: 10.3748/wjg.v20.i40.14884
Published online Oct 28, 2014. doi: 10.3748/wjg.v20.i40.14884
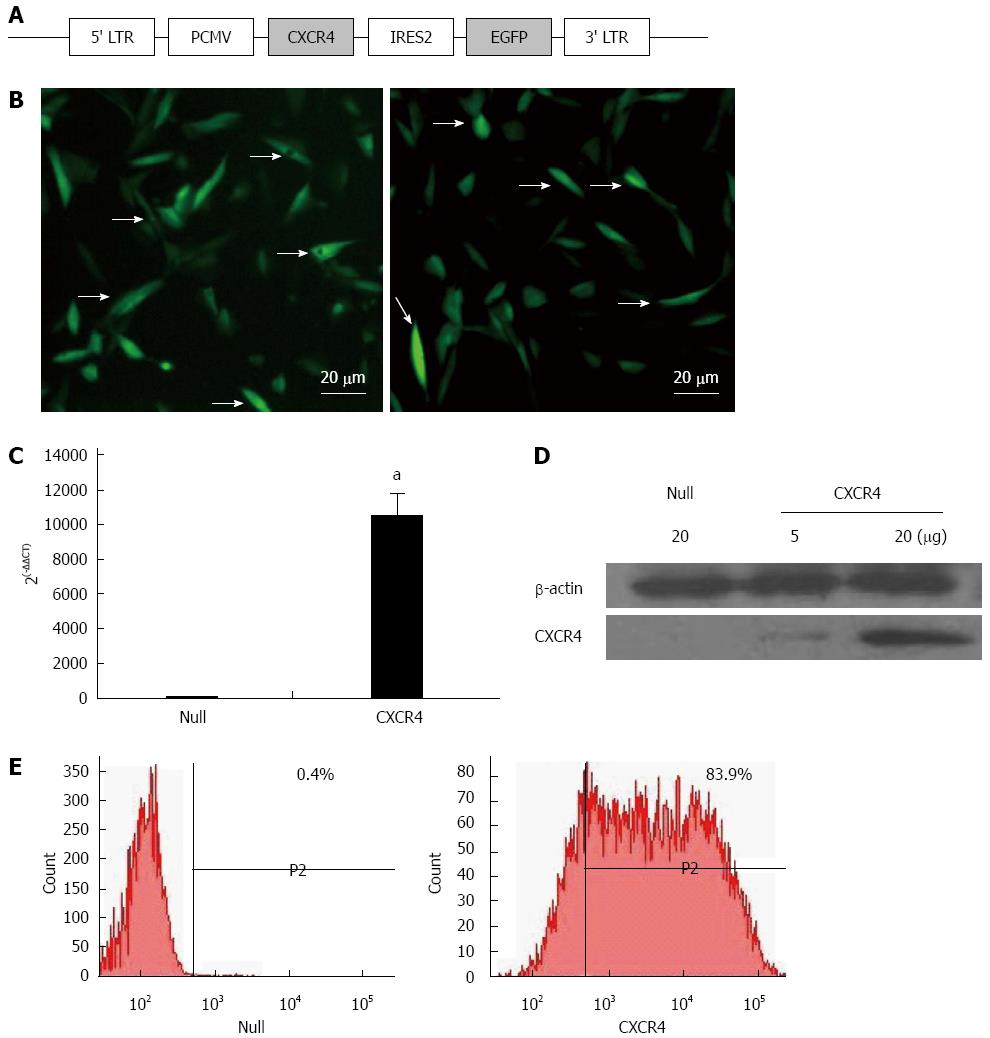
Figure 1 Chemokine CXC receptor 4 expression in genetically modified mesenchymal stem cells.
A: Schematic representation of the lentiviral vector constructs; B: Fluorescence microscopy of green fluorescence protein (GFP)/Null-mesenchymal stem cells (MSCs) and GFP/chemokine CXC receptor 4 (CXCR4)-MSCs. Most MSCs were uniformly transfected with GFP gene (arrows). Scale bar = 20 μm; C: CXCR4 gene relative expression by quantitative real-time polymerase chain reaction; D: CXCR4 expression on the membrane was determined by Western blotting using MSC membrane extraction. CXCR4: CXCR4/GFP group; Null: null/GFP group; E: Flow cytometry analysis of CXCR4 expression in Null-MSCs (left) and CXCR4-MSCs (right). Horizontal bar of each label in panel represents subpopulation of MSCs. LTR: Long terminal repeat. aP < 0.05 vs Null group, data are shown as mean ± SD.
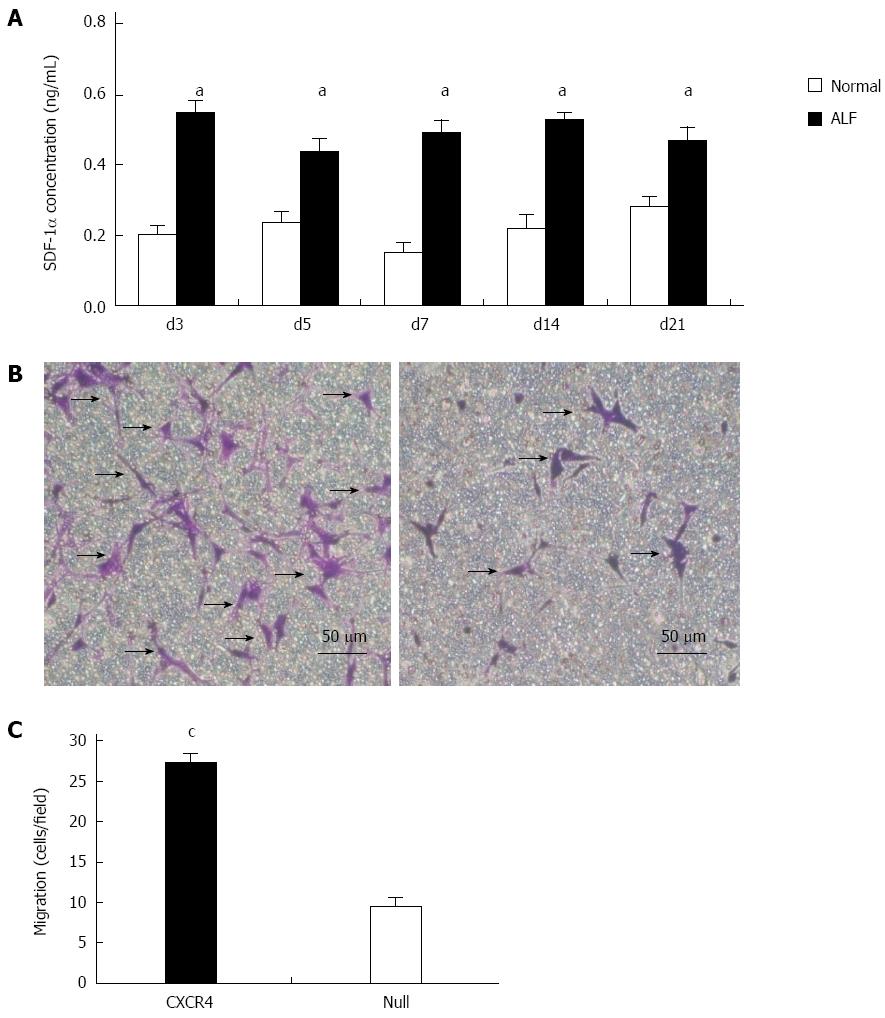
Figure 2 Chemokine CXC receptor 4 gene enhances mesenchymal stem cells migration depending on stromal cell-derived factor-1α.
A: Stromal cell-derived factor (SDF)-1α expression in acute liver failure (ALF). Values are mean ± SD, n = 6 for each group; B: Images of transmigrated chemokine CXC receptor 4 (CXCR4)-mesenchymal stem cells (MSCs) (left) and Null-MSCs (right) in response to 50 ng/mL SDF-1α in Transwell assay; C: Average number of cells migrated in Transwell assay. Results are mean values ± SD of five different fields from four independent experiments. aP < 0.05 vs normal group; cP < 0.05 vs Null group, data are shown as mean ± SD.
Figure 3 Indirect coculture with mesenchymal stem cells enhanced viability of the thioacetamide-damaged hepatocytes.
A: Viability of damaged mouse hepatocytes cocultured with chemokine CXC receptor 4 (CXCR4)-mesenchymal stem cells (MSCs) or Null-MSCs; B: Caspase-3 activity of damaged mouse hepatocytes cocultured with CXCR4-MSCs or Null-MSCs. aP < 0.05 vs thioacetamide (TAA) group, data are shown as the mean ± SD.
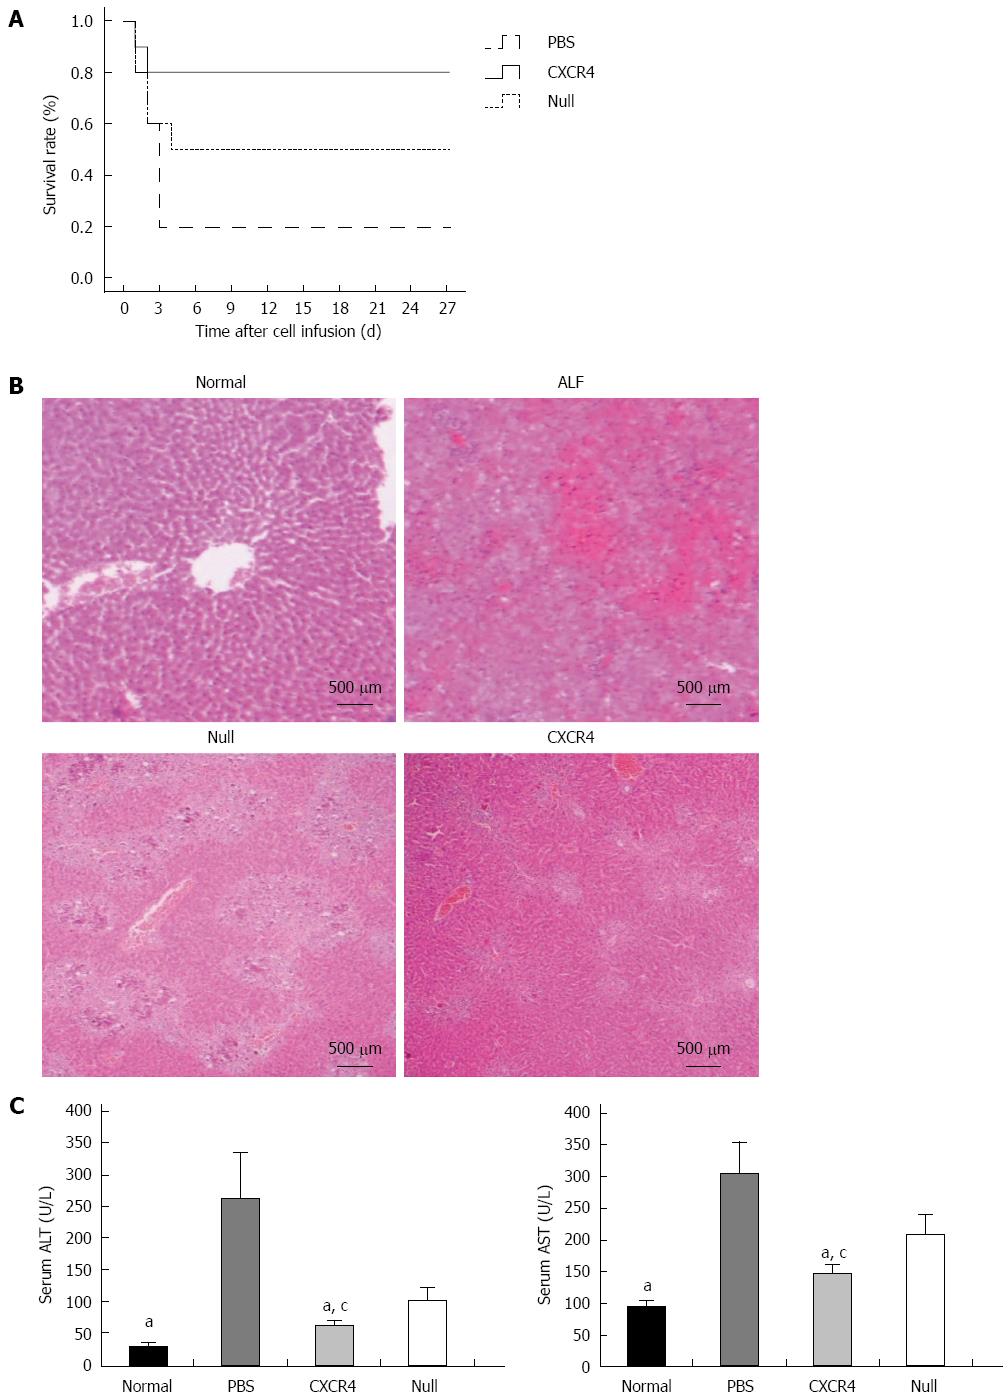
Figure 4 Transplantation of chemokine CXC receptor 4-mesenchymal stem cells or Null-mesenchymal stem cells improved survival rate and histopathological recovery, and inhibited liver enzyme release in acute liver failure.
A: Survival analysis of CCl4-treated nude mice; B: HE staining: normal liver tissue; acute liver failure (ALF) mice showed typical histology with extensive hepatocyte necrosis and hemorrhage involving entire lobules; ALF mice transplanted with Null-mesenchymal stem cells (MSCs); ALF mice transplanted with chemokine CXC receptor 4 (CXCR4)-MSCs; C: Aspartate aminotransferase (AST) and alanine aminotransferase (ALT) enzyme levels in peripheral blood samples collected at 7 d after transplantation. aP < 0.05 vs phosphate-buffered saline (PBS) group; cP < 0.05 vs Null group, data are shown as mean ± SD.
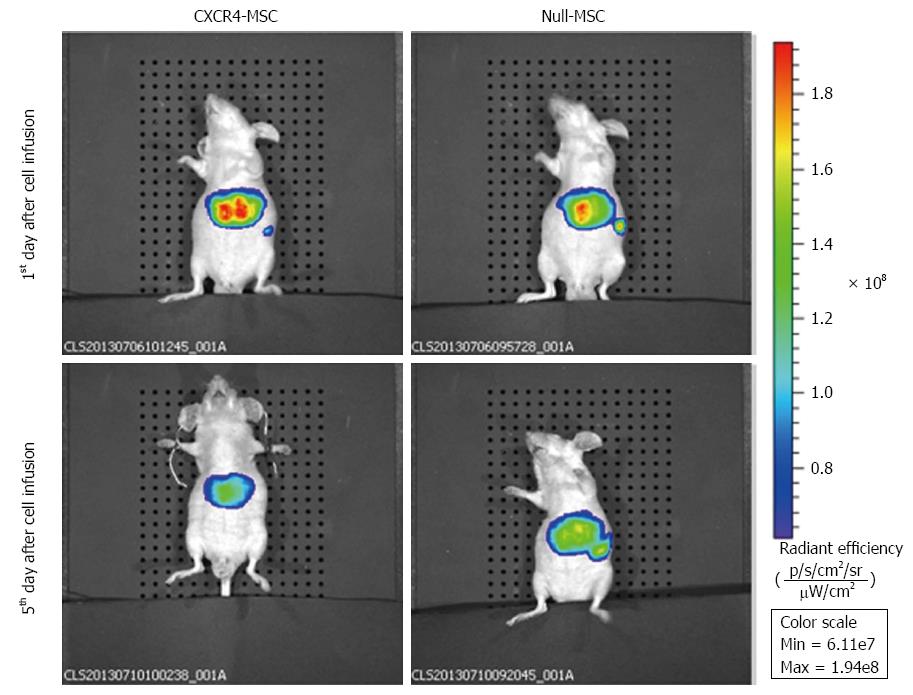
Figure 5 In vivo fluorescence images of nude mice at 1 and 5 d after injecting DiR-labeled mesenchymal stem cells via the tail vein.
At 1 d after transplantation in the chemokine CXC receptor 4 (CXCR4) group, a strong fluorescence signal was detected in the liver, whereas the fluorescence intensity was low in the spleen. In the Null group, the liver and spleen both exhibited a strong fluorescence signal and the intensity was almost the same. At 5 d following transplantation, the fluorescence signal in the spleen of the CXCR4 group could not be detected, and in the Null group, although the fluorescence intensity decreased compared with 1 d after transplantation, the liver and spleen showed nearly the same signal intensity. MSC: Mesenchymal stem cells.
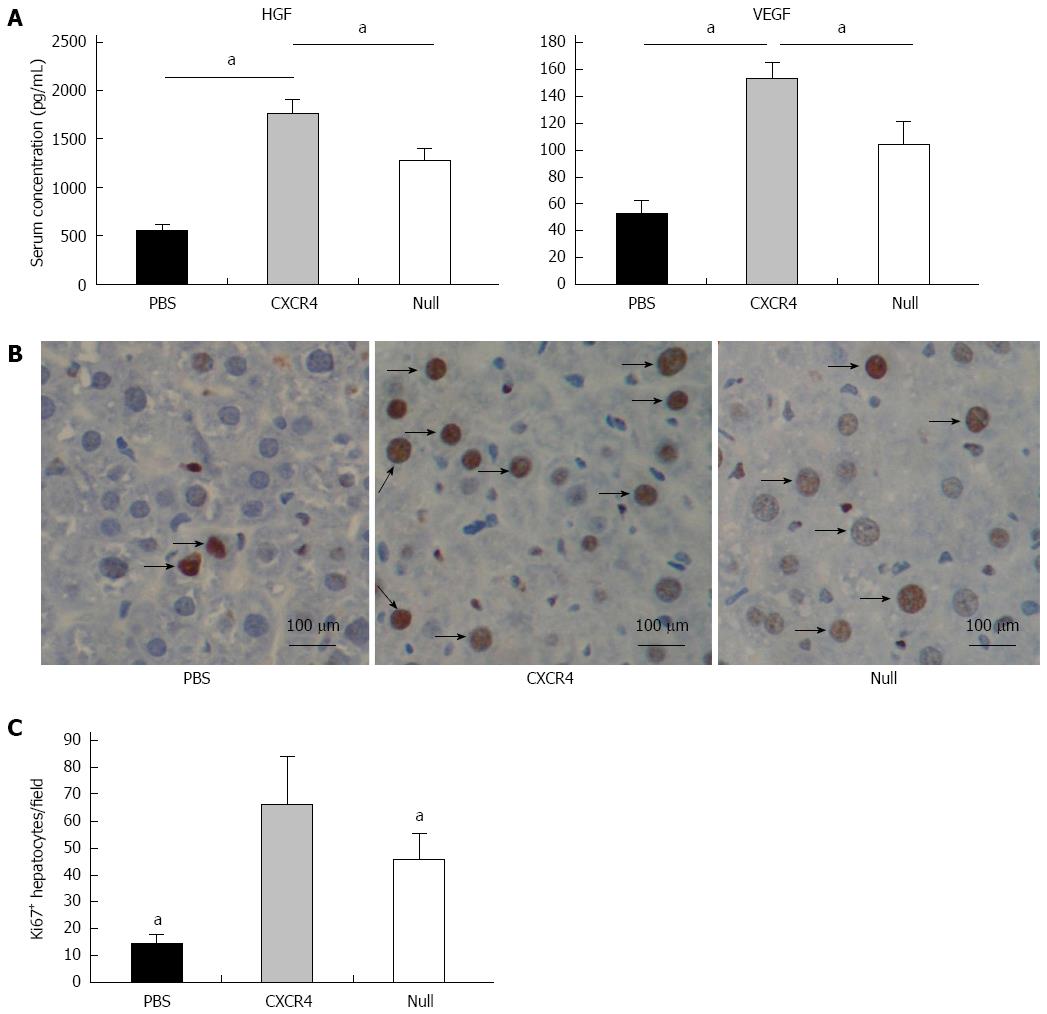
Figure 6 Cell transplantation improved hepatocyte proliferation via growth factors.
A: Levels of hepatocyte-generating factors (HGF) and vascular endothelial growth factor (VEGF); B: Immunohistochemistry analyses of Ki67 expression in liver tissues; C: Quantitative image analyses of the number of Ki67+ cells. aP < 0.05 vs CXC receptor 4 group, data are shown as mean ± SD.
- Citation: Ma HC, Shi XL, Ren HZ, Yuan XW, Ding YT. Targeted migration of mesenchymal stem cells modified with CXCR4 to acute failing liver improves liver regeneration. World J Gastroenterol 2014; 20(40): 14884-14894
- URL: https://www.wjgnet.com/1007-9327/full/v20/i40/14884.htm
- DOI: https://dx.doi.org/10.3748/wjg.v20.i40.14884


