Copyright
©2014 Baishideng Publishing Group Inc.
World J Gastroenterol. Oct 28, 2014; 20(40): 14760-14777
Published online Oct 28, 2014. doi: 10.3748/wjg.v20.i40.14760
Published online Oct 28, 2014. doi: 10.3748/wjg.v20.i40.14760
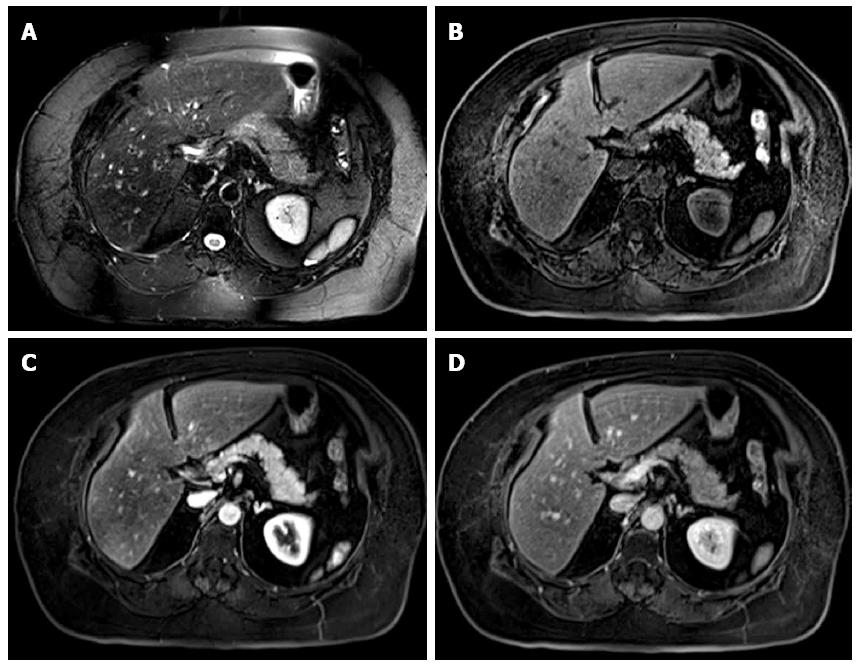
Figure 1 Normal pancreatic appearance on magnetic resonance imaging.
A: Axial single-shot turbo spin-echo T2-weighted (HASTE) image with fat-suppression; B: Axial pre-contrast 3D-GRE T1-weighted image with fat-suppression. Axial post-Gadolinium 3D-GRE T1-weighted image with fat-suppression during the hepatic arterial-dominant (C) and hepatic-venous phases (D). The pancreas demonstrates low T2 signal intensity (A) and high T1 signal intensity on pre-contrast images (B) reflecting high protein content of the exocrine gland. The pancreas demonstrates maximal enhancement on hepatic arterial-dominant phase (C); which fades on subsequent phases; reflecting a normal capillary blush.
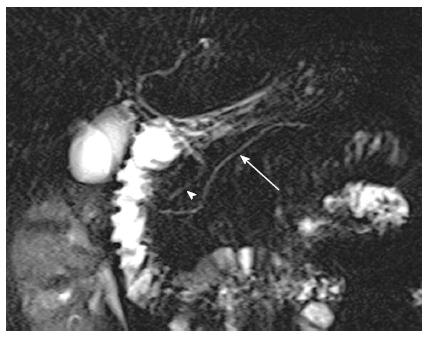
Figure 2 Normal magnetic resonance cholangiopancreatogram.
Coronal oblique thick-slab magnetic resonance cholangiopancreatogram (MRCP) image. There is normal course and normal uniform diameter of the pancreatic (arrow) and extra-hepatic biliary ducts (arrowhead). This sequence requires less than 1 s to acquire and is very sensitive for detecting stones.
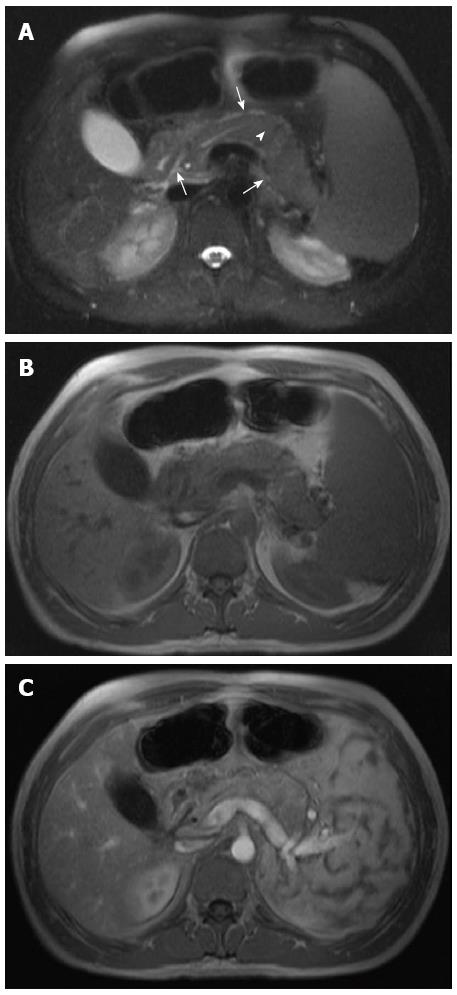
Figure 3 Mild acute interstitial edematous pancreatitis.
A: Axial single-shot turbo spin-echo T2-weighted (HASTE) image; B: Axial pre-contrast 3D-GRE T1-weighted images with fat-suppression; C: Axial post-Gadolinium 3D-GRE T1-weighted images with fat-suppression during the hepatic arterial-dominant phases. There is mild lace-like increased T2 signal involving the pancreatic parenchyma, associated with effacement of the distal pancreatic duct (arrowhead), due to surrounding edema, and minimal amount of peripancreatic fluid around (arrows) the head and body (A). The pancreas demonstrates mildly enlarged distal body and tail (A-C); with diffuse minimally decreased T1 signal intensity (B); and mild heterogeneous enhancement of the distal body and tail on the hepatic arterial-dominant phase (C) in keeping with diffuse edematous pancreatitis.
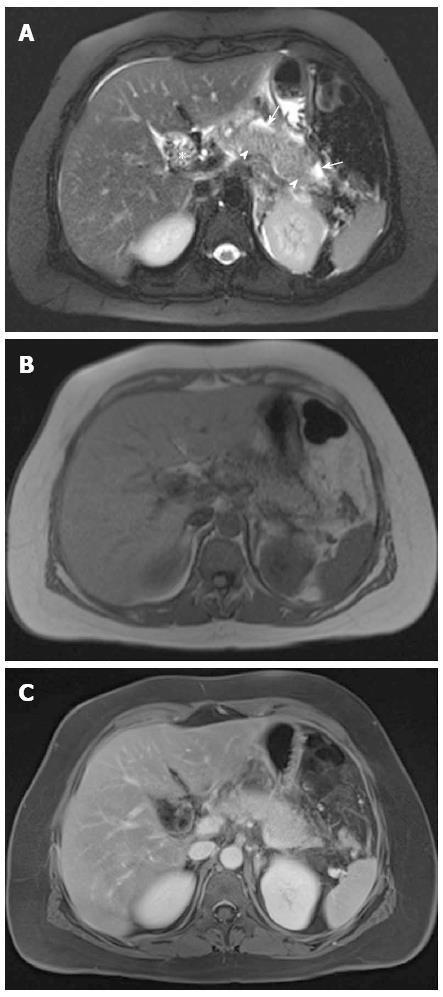
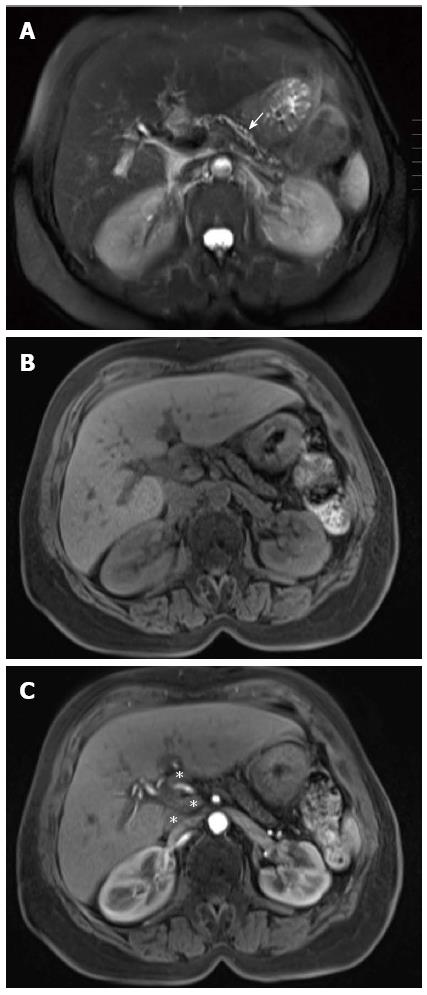
Figure 4 Gallstone acute interstitial edematous pancreatitis.
A: Axial single-shot turbo spin-echo T2-weighted (HASTE) image with fat-suppression; B: Axial in-phase T1-weighted image; C: Axial post-Gadolinium 3D-GRE T1-weighted image with fat-suppression during the hepatic arterial-dominant phase. There is mild diffuse lace-like increased T2 signal involving the pancreatic parenchyma (arrowheads), associated with a small amount of peripancreatic fluid (arrows) (A). The pancreas demonstrates diffuse minimal decreased T1 signal intensity with peripancreatic stranding (B); in addition to minimally reduced homogenous enhancement (C) in keeping in with diffuse edematous pancreatitis. There are also innumerable gallstones (asterisk) (A).
Figure 5 Acute interstitial edematous pancreatitis with acute peripancreatic fluid collection.
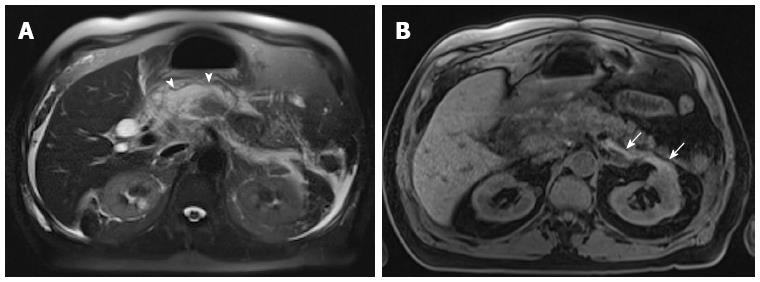
A: Axial single-shot turbo spin-echo T2-weighted (HASTE) image with fat-suppression; B: Axial 3D-GRE T1-weighted image with fat-suppression. The pancreas shows mild lace-like increased T2 signal involving the pancreatic parenchyma (A), with minimally decreased T1 signal intensity and mild peripancreatic stranding (B), associated with peripancreatic fluid collections (arrowheads, A) and small proteinaceous fluid at the left anterior para- and peri-renal spaces (arrows); both associated with imperceptible wall in keeping with acute interstitial edematous pancreatitis and acute peripancreatic fluid collection. Minimal ascites is also seen (A).
Figure 6 Pancreatic and peripancreatic necrosis.
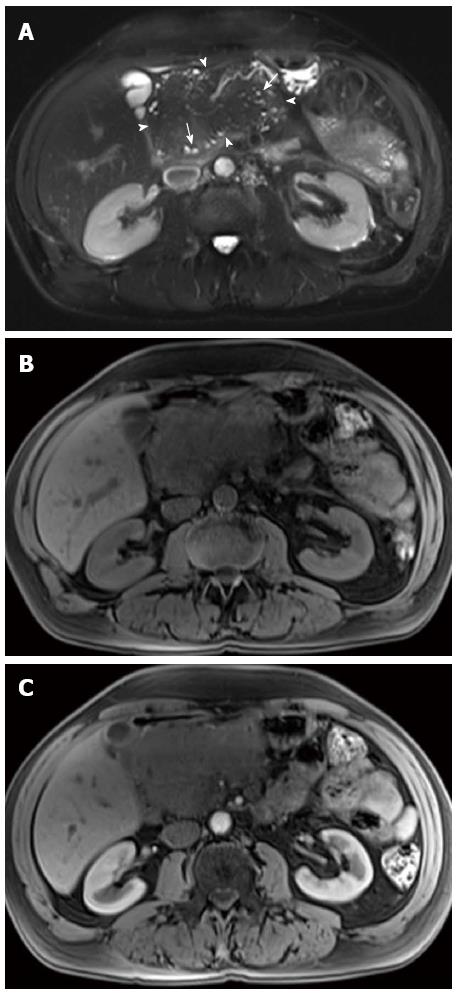
A: Axial single-shot turbo spin-echo T2-weighted (HASTE) image with fat-suppression. Axial post-Gadolinium 3D-GRE T1-weighted image with fat-suppression during the B hepatic arterial-dominant and C hepatic-venous phases. The pancreas shows very heterogeneous increased T2 signal (asterisk) (A) and no appreciable enhancement on the post-Gadolinium images (arrowheads) (B, C); associated with a large peripancreatic fluid collection (arrow) (A-C) and a thick enhancing rim on delayed images (C) in keeping with pancreatic and peripancreatic necrosis.
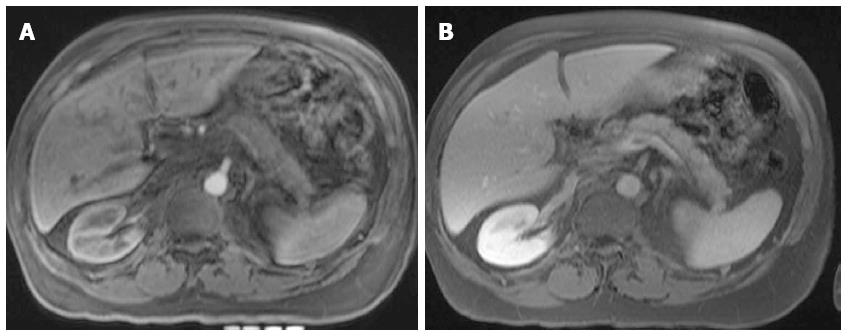
Figure 7 Necrotizing pancreatitis.
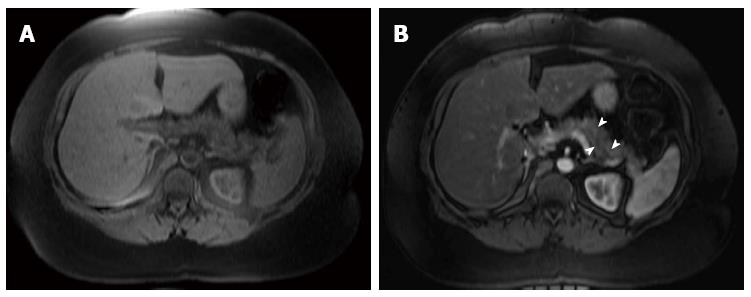
A: Axial T1-weighted fast low-angle shot (FLASH) image with fat-suppression; B: Axial post-Gadolinium 3D-GRE T1-weighted image with fat-suppression during the hepatic arterial-dominant phase. The pancreas shows diffuse decreased T1 signal intensity (A) with patchy areas of minimal enhancement (arrowheads) (B) in keeping with necrotizing pancreatitis.
Figure 8 Gallstone acute edematous pancreatitis with acute peripancreatic fluid collection.
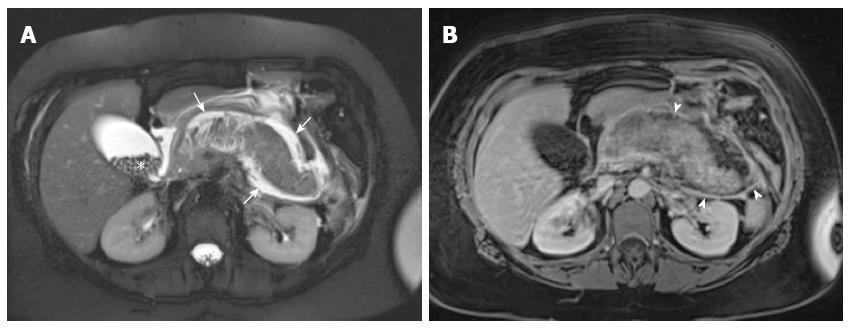
A: Axial single-shot turbo spin-echo T2-weighted (HASTE) image with fat-suppression; B: Axial post-Gadolinium 3D-GRE T1-weighted image with fat-suppression. There is diffuse lace-like increased T2 signal involving the pancreatic parenchyma (A), minimally reduced enhancement post-Gadolinium, peripancreatic stranding, and thick rim of enhancement (arrowheads) surrounding the pancreas (B), associated with peripancreatic fluid collection (arrows) in keeping with diffuse edematous pancreatitis and peripancreatic acute peripancreatic fluid collection. There are also innumerable gallstones (asterisk) (A).
Figure 9 Large pancreatic pseudocyst.
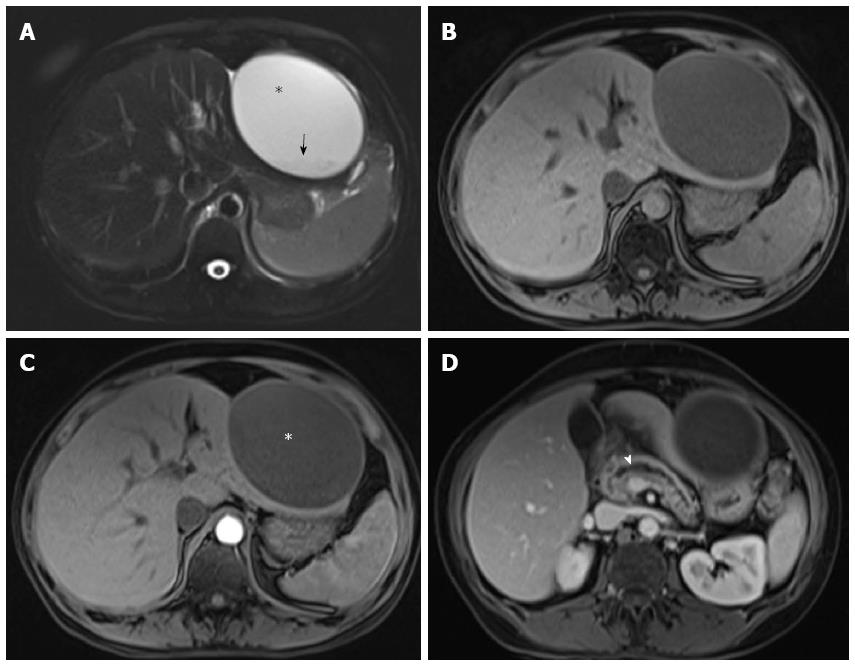
A: Axial single-shot turbo spin-echo T2-weighted (HASTE) image with fat-suppression; B: Axial pre-contrast 3D-GRE T1-weighted image with fat-suppression. Axial post-Gadolinium 3D-GRE T1-weighted image with fat-suppression during (C) the true late hepatic arterial and (D) hepatic-venous phases. There is a large oval shaped thin walled cyst (asterisks) with homogenously increased T2 (A) and decreased T1 signal intensities (B) at the left subdiaphragmatic region, with dependent non-enhancing (C) layering material (arrows) (A, B). The cyst demonstrates mild wall enhancement (C, D) in keeping with a large pancreatic pseudocyst. There is also diffuse pancreatic parenchyma thinning, irregular diffuse main pancreatic ducal dilatation (arrowhead), and pancreatic side-branches ductal prominence in keeping with chronic pancreatitis (D).
Figure 10 Multiple intrapancreatic pseudocysts.
Coronal (A) and axial (B) single-shot turbo spin-echo T2-weighted (HASTE) image with fat-suppression; C: Axial post-Gadolinium 3D-GRE T1-weighted image with fat-suppression during the hepatic arterial-dominant phase. There are multiple thin walled cysts, some of which show multi-loculation (asterisks) (A) within the pancreatic parenchyma extending into the lesser sac and porta hepatis (A-C) and demonstrate mild uniform wall enhancement (arrowheads) (C) in keeping with multiple pseudocysts.
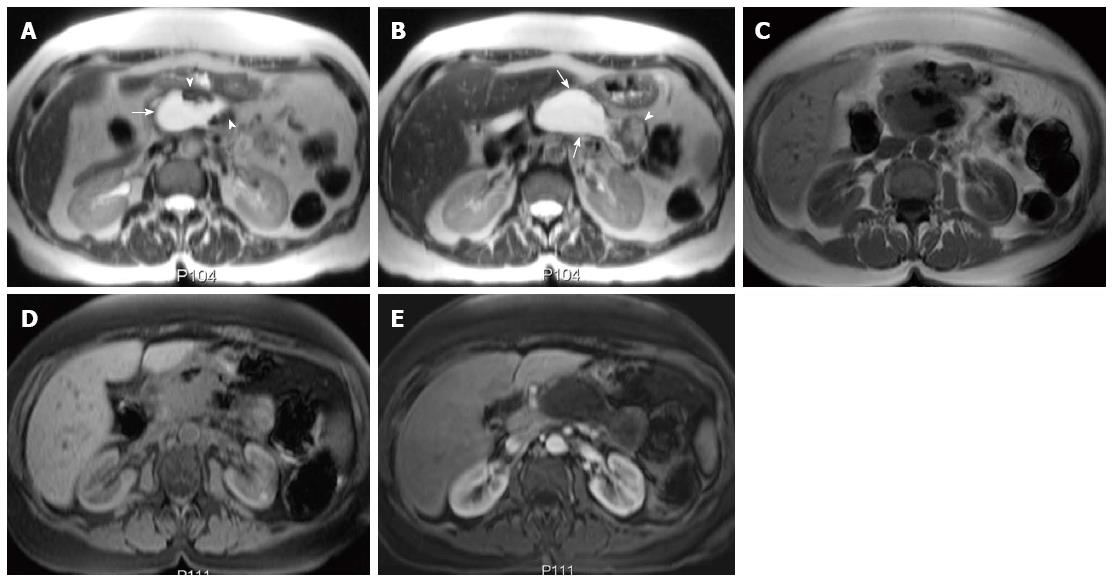
Figure 11 Acute necrotic collection.
A, B: Axial single-shot turbo spin-echo T2-weighted (HASTE) image; C: Axial fast low-angle shot (FLASH) in-phase T1-weighted image; D: Axial FLASH in-phase T1-weighted image with fat-suppression; E: Axial post-Gadolinium 3D-GRE T1-weighted image with fat-suppression during the hepatic arterial-dominant phase. There is a well-defined fluid collection (arrows) replacing a great portion of the pancreatic parenchyma and extending into the peripancreatic tissue, associated with few internal areas of decreased T2 signal intensity (arrowheads) (A); which do not show any appreciable enhancement (B, C) in keeping with acute necrotic collection.
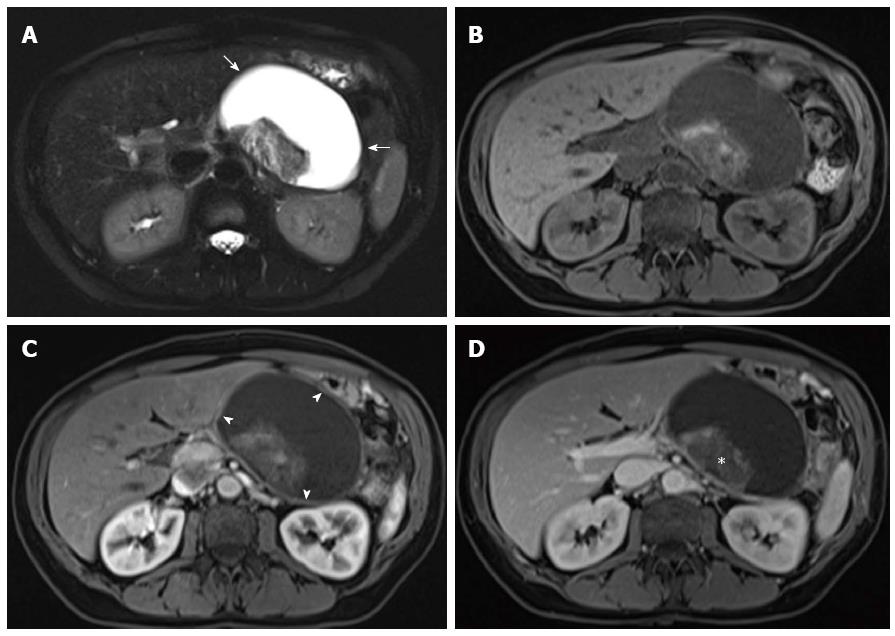
Figure 12 Necrotizing pancreatitis with peripancreatic walled-off necrosis.
A: Axial single-shot turbo spin-echo T2-weighted (HASTE) image. Axial (B) pre- and post-Gadolinium 3D-GRE T1-weighted images with fat-suppression during the hepatic arterial-dominant (C) and hepatic-venous phases (D). There is a well-defined fluid collection (arrows) at the region of the pancreatic body/tail (A, B); which demonstrates a uniform mildly enhancing thickened rim (arrowheads) (C,D) and contains a dependent non-enhancing debris (asterisk) (C, D) in keeping with necrotizing pancreatitis and walled-off necrosis.
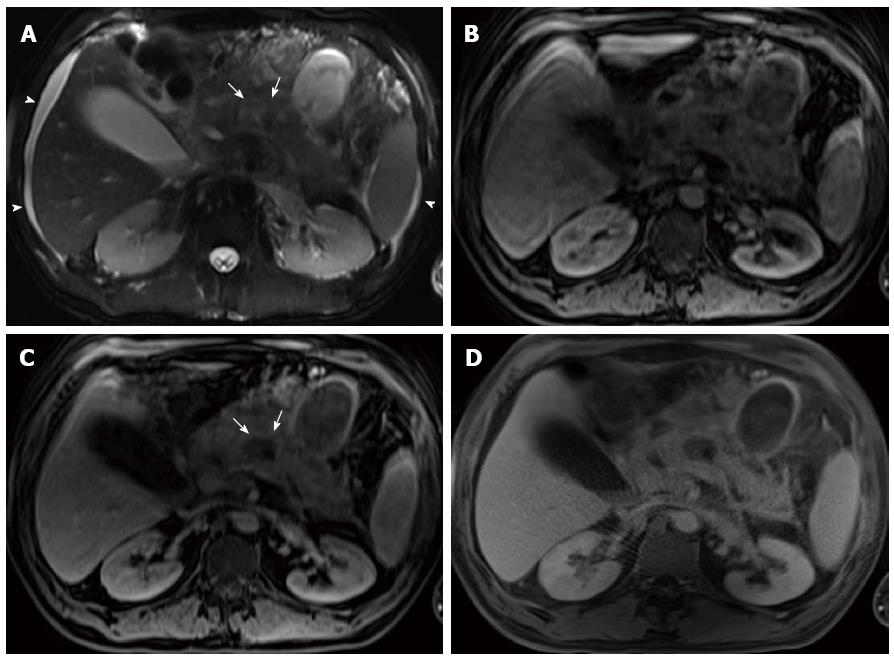
Figure 13 Infected peripancreatic fluid and interrupted duct syndrome in a patient with acute pancreatitis.
A: Axial single-shot turbo spin-echo T2-weighted (HASTE) image with fat-suppression. Axial pre- (B) and post- (C) Gadolinium 3D-GRE T1-weighted images with fat-suppression during the hepatic arterial-dominant phase; D: Axial post-Gadolinium radial 3D-GRE T1-weighted images with fat-suppression during the interstitial phase. There is a large irregular multiloculated (partially visualized) peripancreatic collection. It demonstrates decreased T2 (A) and T1 (B) signal with a thick rim of increased T2 signal (arrows) (A) that shows enhancement on delayed images (arrows, C, D) in keeping with infected necrotic collection (proven by fine needle aspiration). There is also a well-defined fluid collection in the lesser sac (asterisk) (A) with an enhancing thin wall (D) and minimal ascites (arrowheads, A). Of note is the motion robustness of the radial 3D-GRE (D) compared to convention 3D-GRE (C) sequence, facilitating imaging of sick uncooperative patients.
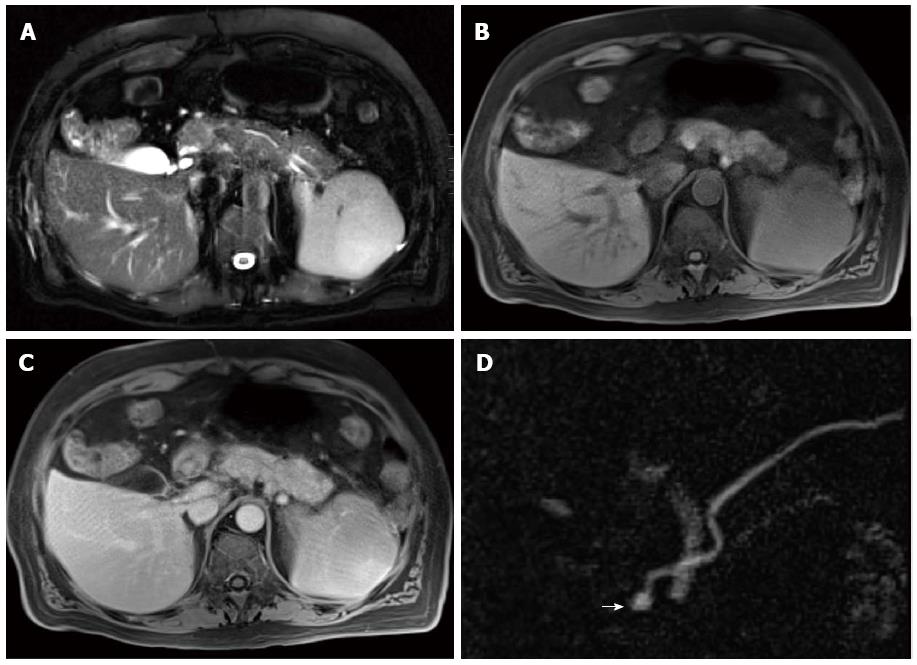
Figure 14 Mild pancreatitis complicated by pancreatic divisum and santorinicele.
A: Axial single-shot turbo spin-echo T2-weighted (HASTE) image with fat-suppression. Axial pre- (B) and post- (C) Gadolinium radial 3D-GRE T1-weighted image with fat-suppression during the hepatic-venous phase; D: Coronal oblique thick-slab magnetic resonance cholangiopancreatogram image. There is mild lace-like increased T2 signal involving the pancreatic parenchyma, associated with a minimal amount of peripancreatic fluid (A) and pachy pancreatic enhancement on post-Gadolinium images (B, C) in keeping with mild acute pancreatitis. There is also abnormal course and insertion of the main pancreatic duct into the minor papilla (D) terminating in a small cystic structure (arrow) in keeping with pancreatic divisum and a small Santorinicele (D).
Figure 15 Chronic pancreatitis.
A: Axial post-Gadolinium 3D-GRE T1-weighted image with fat-suppression during the hepatic arterial-dominant phase; B: Axial post-Gadolinium FLASH in-phase T1-weighted image with fat-suppression during the hepatic-venous phases. The pancreatic body and tail show poor early contrast enhancement (A) and mild enhancement on the delayed images related to fibrosis (B) in keeping with chronic pancreatitis.
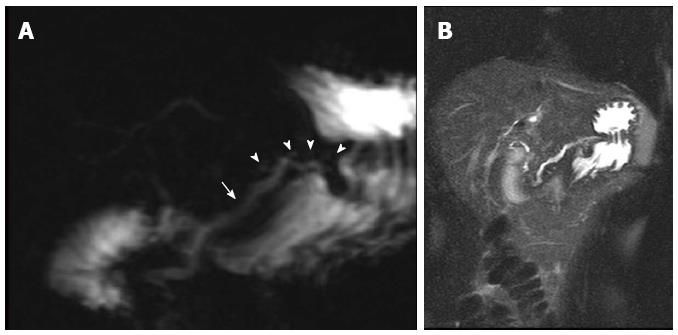
Figure 16 Mild chronic pancreatitis.
A: Coronal oblique thick-slab magnetic cholangiopancreatogram image; B: Coronal single-shot turbo spin-echo T2-weighted (HASTE) image with fat-suppression. There is uniform dilatation of the pancreatic duct (arrow) and prominence of the pancreatic duct side-branches (arrowheads), without significant diffuse thinning of the pancreatic parenchyma (A, B) in keeping with mild chronic pancreatitis.
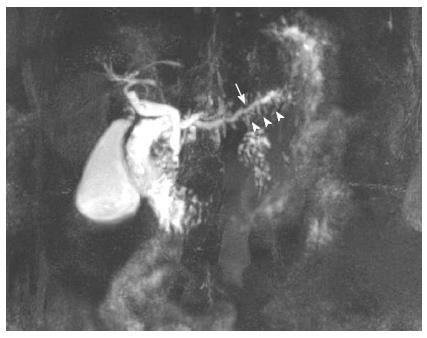
Figure 17 Chronic pancreatitis.
Coronal oblique maximal intensity projection image of a 3D magnetic cholangiopancreatogram image. There is mild pancreatic main ductal (arrow) and side branches (arrowheads) dilatation in keeping with chronic pancreatitis.
Figure 18 Chronic pancreatitis.
A: Axial single-shot turbo spin-echo T2-weighted (HASTE) image. Axial pre- (B) and post- (C) Gadolinium 3D-GRE T1-weighted image with fat-suppression during the hepatic arterial-dominant phase. There is evidence of diffuse atrophy of the pancreatic parenchyma with mild uniform pancreatic ductal dilatation (arrow) and pancreatic side-branches prominence (A), associated with diminished T1 signal intensity (B) and minimal arterial enhancement (C) in keeping with chronic pancreatitis. There are also few prominent lymph nodes in the peripancreatic and porta hepatis lymph nodes (asterisks) (A-C).
Figure 19 Chronic inflammatory mass simulating pancreatic adenocarcinoma.
A: Axial T2-weighted image with fat-suppression; B: Pre-contrast 3D-GRE T1-weighted image with fat-suppression during the hepatic arterial dominant phase; C: Post-contrast 3D-GRE T1-weighted image with fat-suppression during the hepatic arterial dominant phase. There is a complex lobulated pancreatic head mass (arrowheads) with multiple foci of increased T2 signal throughout (arrows) (A), associated with decreased pancreatic parenchymal T1 signal (B), proximal pancreatic ductal dilation (not shown), and diminished enhancement on post-Gadolinium images (C) in keeping the diagnosis of focal chronic pancreatitis.
Figure 20 Autoimmune pancreatitis.
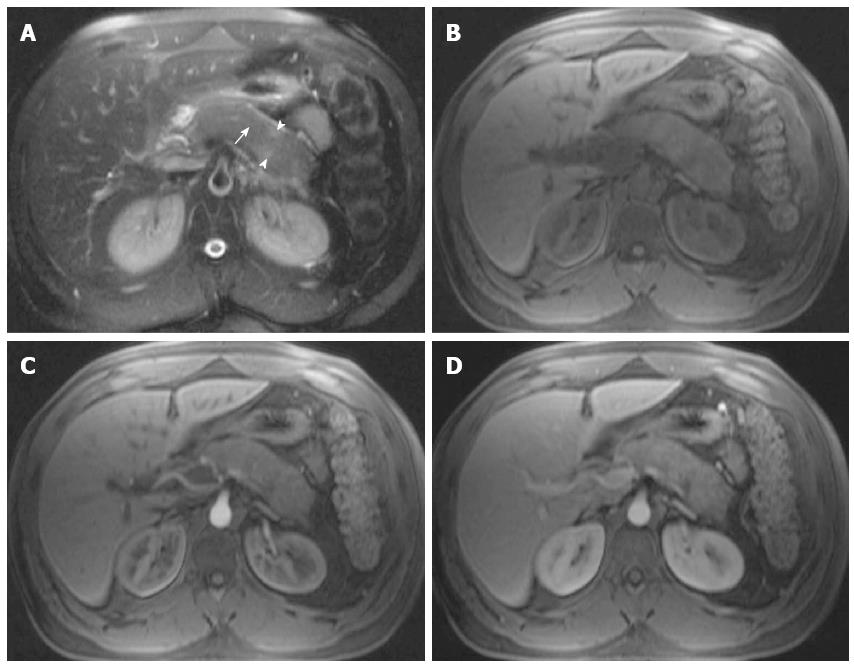
A: Axial single-shot turbo spin-echo T2-weighted (HASTE) image with fat-suppression; B: Axial T1-weighted image. Post-Gadolinium 3D-GRE T1-weighted images with fat-suppression during the hepatic arterial-dominant (C) and hepatic-venous phases (D). There is evidence of diffuse pancreatic swelling with patchy mildly increased T2 signal (arrowheads) (A), decreased T1 signal (B), loss of the normal pancreatic lobulations, and diffuse obliteration of the pancreatic duct (arrow) (A); associated with patchy decreased early enhancement (C) and progression of enhancement on subsequent phases (D) in keeping with autoimmune pancreatitis.
Figure 21 Segmental form groove pancreatitis.
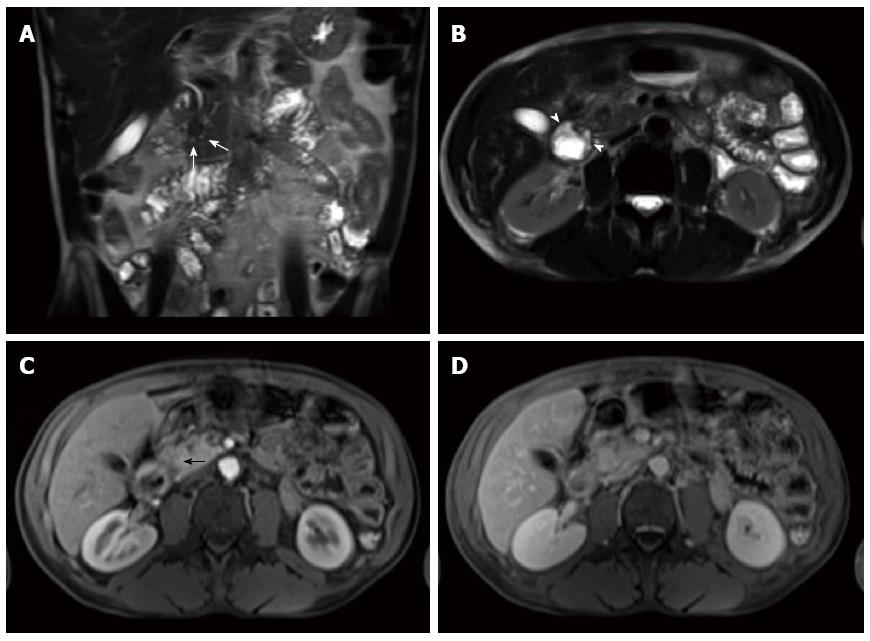
Coronal (A) and axial (B) single-shot turbo spin-echo T2-weighted (HASTE) images with fat-suppression. Axial post-Gadolinium 3D-GRE T1-weighted images with fat-suppression during the hepatic arterial-dominant (C) and interstitial phases (D). There is mild duodenal thickening and edema (arrowheads) (A, B) associated with a sheet-like mass in the pancreaticoduodenal groove that extends to the pancreatic head and demonstrates decreased T1 signal pre-contrast (not shown), slightly decreased T2 signal with tiny cystic changes (white arrows) (A, B), early arterial hypo-enhancement (black arrow) (C) and progressive enhancement on the subsequent delayed images (D) due to fibrosis, in keeping with segmental form groove pancreatitis.
- Citation: Manikkavasakar S, AlObaidy M, Busireddy KK, Ramalho M, Nilmini V, Alagiyawanna M, Semelka RC. Magnetic resonance imaging of pancreatitis: An update. World J Gastroenterol 2014; 20(40): 14760-14777
- URL: https://www.wjgnet.com/1007-9327/full/v20/i40/14760.htm
- DOI: https://dx.doi.org/10.3748/wjg.v20.i40.14760


