Copyright
©2014 Baishideng Publishing Group Inc.
World J Gastroenterol. Oct 28, 2014; 20(40): 14672-14685
Published online Oct 28, 2014. doi: 10.3748/wjg.v20.i40.14672
Published online Oct 28, 2014. doi: 10.3748/wjg.v20.i40.14672
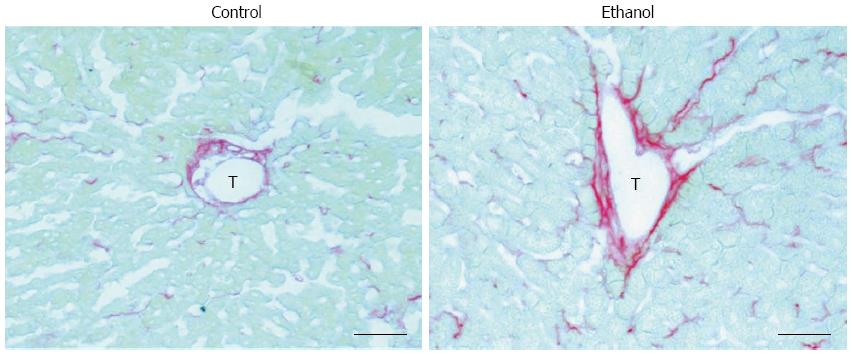
Figure 1 Fatty liver is associated with perivenular fibrinogenesis in rats.
Control: 7-wk control liquid diet-fed rat; Ethanol: 7-wk 5 g/dL ethanol liquid diet-fed rat. T: Terminal hepatic venule, scale bars = 50 μm.
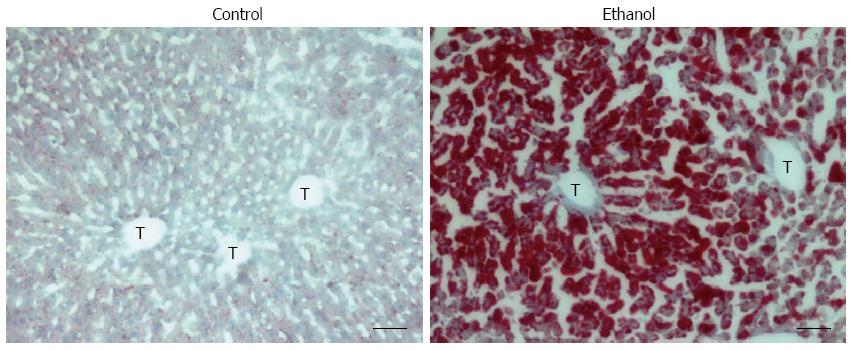
Figure 2 Alcohol-induced hepatosteatosis in rats.
Oil red O staining of liver sections; Control: 7-wk control liquid diet-fed rat; Ethanol: 7-wk 5 g/dL ethanol liquid diet-fed. T: Terminal hepatic venule. Scale bars = 50 μm.
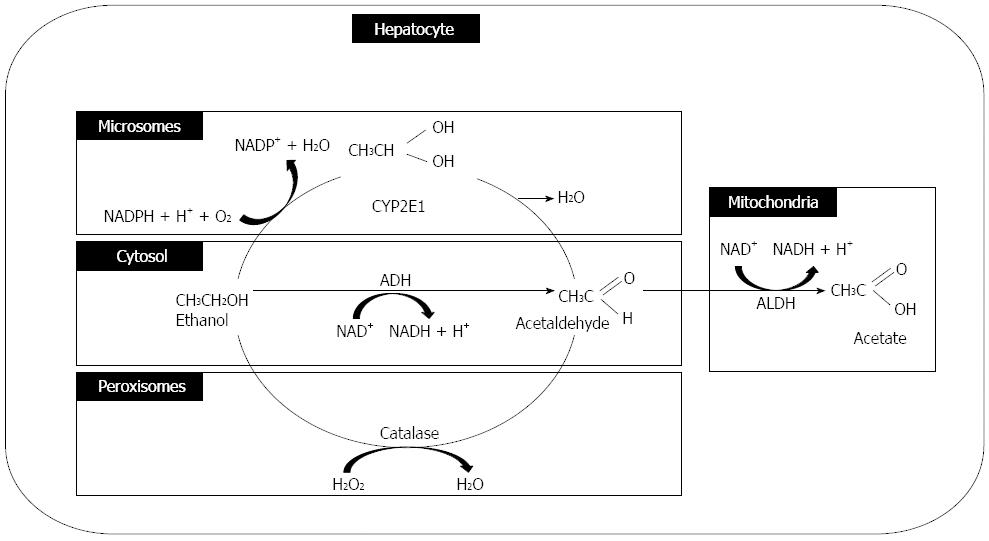
Figure 3 Ethanol metabolism.
ADH: Alcohol dehydrogenase; ALDH: Aldehyde dehydrogenase.
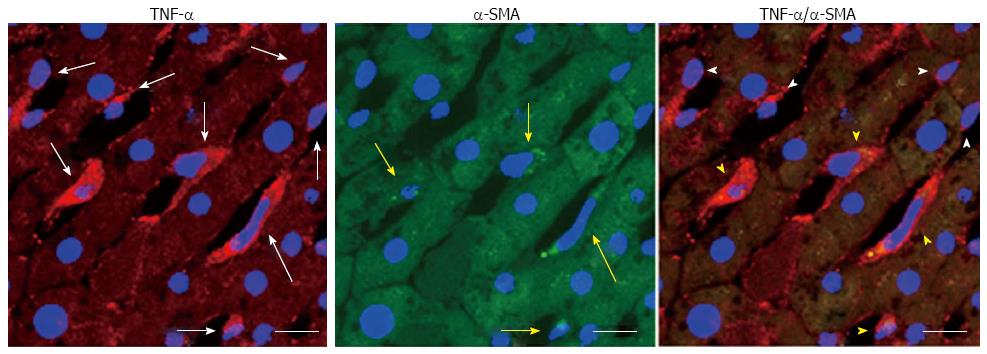
Figure 4 Ethanol-activated hepatic stellate cells, which can product tumor necrosis factor-α in rats fed with a 7-wk 5 g/dL ethanol liquid diet.
The white arrows indicate tumor necrosis factor (TNF)-α positive cells; yellow arrows indicate cells positive for α-smooth muscle actin (α-SMA), a marker of activated hepatic stellate cells; white arrowheads indicate TNF-α positive cells that did not overlap with α-SMA positive cells; yellow arrowheads indicate cells that are both TNF-α- and α-SMA-positive; scale bar = 10 μm.
Figure 5 Carvedilol attenuates the development of ethanol-induced hepatosteatosis.
Oil red O staining of liver sections; Control: 7-wk control liquid diet-fed rat; Ethanol: 7-wk 5 g/dL ethanol liquid diet-fed rat; Ethanol + carvedilol: 7-wk 5 g/dL ethanol liquid diet-fed rat with one-week carvedilol pretreatment (10 mg/kg body weight/d) before the end of the study. Scale bars = 200 μm.
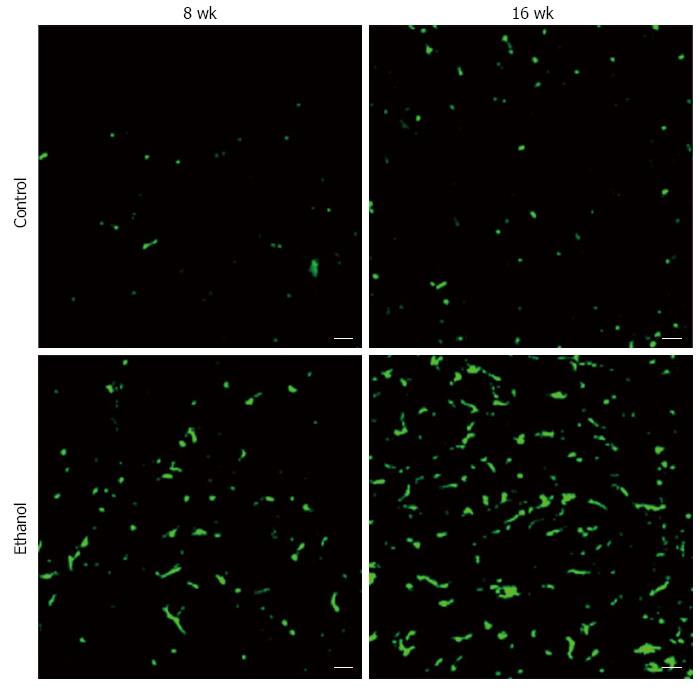
Figure 6 Bone marrow-derived cells increase in a time-dependent manner in the alcoholic fatty liver disease mouse liver.
Control: 4 wk after the bone marrow transplantation [from male transgenic mice expressing green fluorescence protein (GFP) to female wild-type mice]. The mice were fed water and standard mouse pellet chow for 8 or 16 wk; Ethanol: 4 wk after the bone marrow transplantation (from male transgenic mice expressing GFP to female wild-type mice), the mice were fed 10 g/dL ethanol and standard mouse pellet chow for 8 or 16 wk; scale bar = 20 μm.
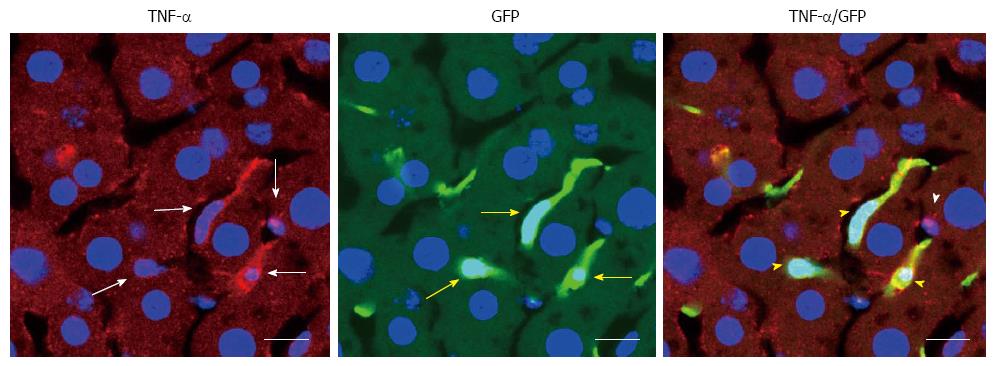
Figure 7 Tumor necrosis factor-α is produced by the bone marrow derived-cells in the alcoholic fatty liver disease mice.
The white arrows indicate tumor necrosis factor (TNF)-α-positive cells; yellow arrows indicate cells positive for green fluorescence protein (GFP), a marker of bone marrow-derived cells; white arrowheads indicate TNF-α positive cells that did not overlap GFP positive cells; yellow arrowheads indicate cells that are both TNF-α- and GFP-positive cells; scale bar = 10 μm.
- Citation: Liu J. Ethanol and liver: Recent insights into the mechanisms of ethanol-induced fatty liver. World J Gastroenterol 2014; 20(40): 14672-14685
- URL: https://www.wjgnet.com/1007-9327/full/v20/i40/14672.htm
- DOI: https://dx.doi.org/10.3748/wjg.v20.i40.14672


